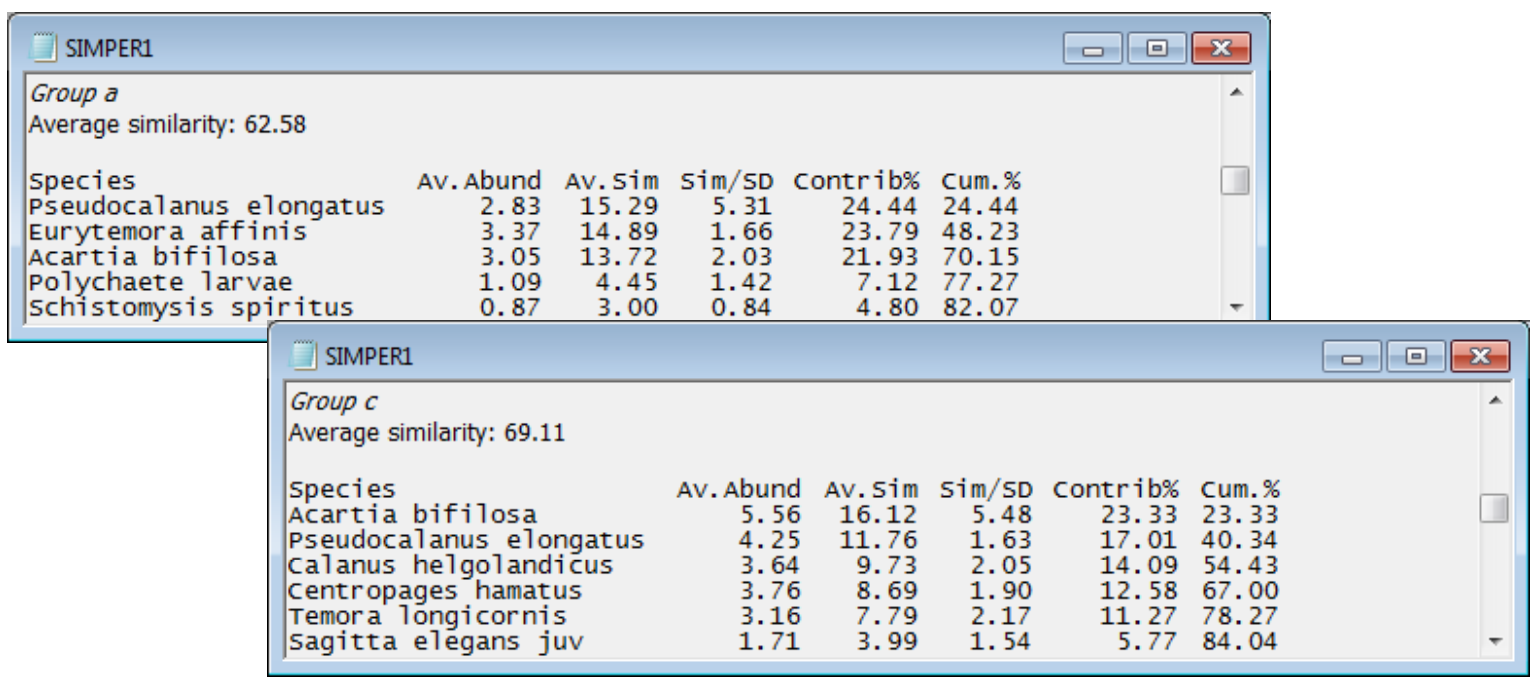
Species typifying a group
Earlier in the results window, tables are given of the contributions of each species to the Bray-Curtis similarity within each of the groups (see Chapter 7 of the methods manual for the formula).
The average Bray-Curtis similarity between all pairs of sites in group a is 62.6, made up mainly of contributions from just three species: P. elongatus (15.3, i.e. 24.4% of total), E. affinis (14.9, i.e. 23.8%), A. bifilosa (13.7, i.e. 21.9%), with a cumulative contribution of 70.2% of the total within- group similarity (the list is again truncated at 80%). These species can be described as typical of Group a (they also have a consistently large presence because the ratio of their contribution to its SD, across the within-group similarities, is relatively high, notably for P. elongatus). However, A. bifilosa and P. elongatus are also typical of group c, which is why they do not head the list of those contributing most to the discrimination between a and c. They did feature lower down in that list, since both have higher average (transformed) values in c than in a (column 1and earlier shade plot).
Save and close the Bristol Channel ws workspace, and if you would like to try another example of SIMPER on a 1-way layout – but this time with a priori groups – open the WA fish ws workspace examined in Section 9, where ANOSIM tests showed that all pairwise comparisons of (predator) fish species gave significantly different (prey) diets, except two pairs involving S. robustus, for which therefore you should not attempt to interpret the SIMPER table of discriminating species.

