Drawing verticals for 3-d plots
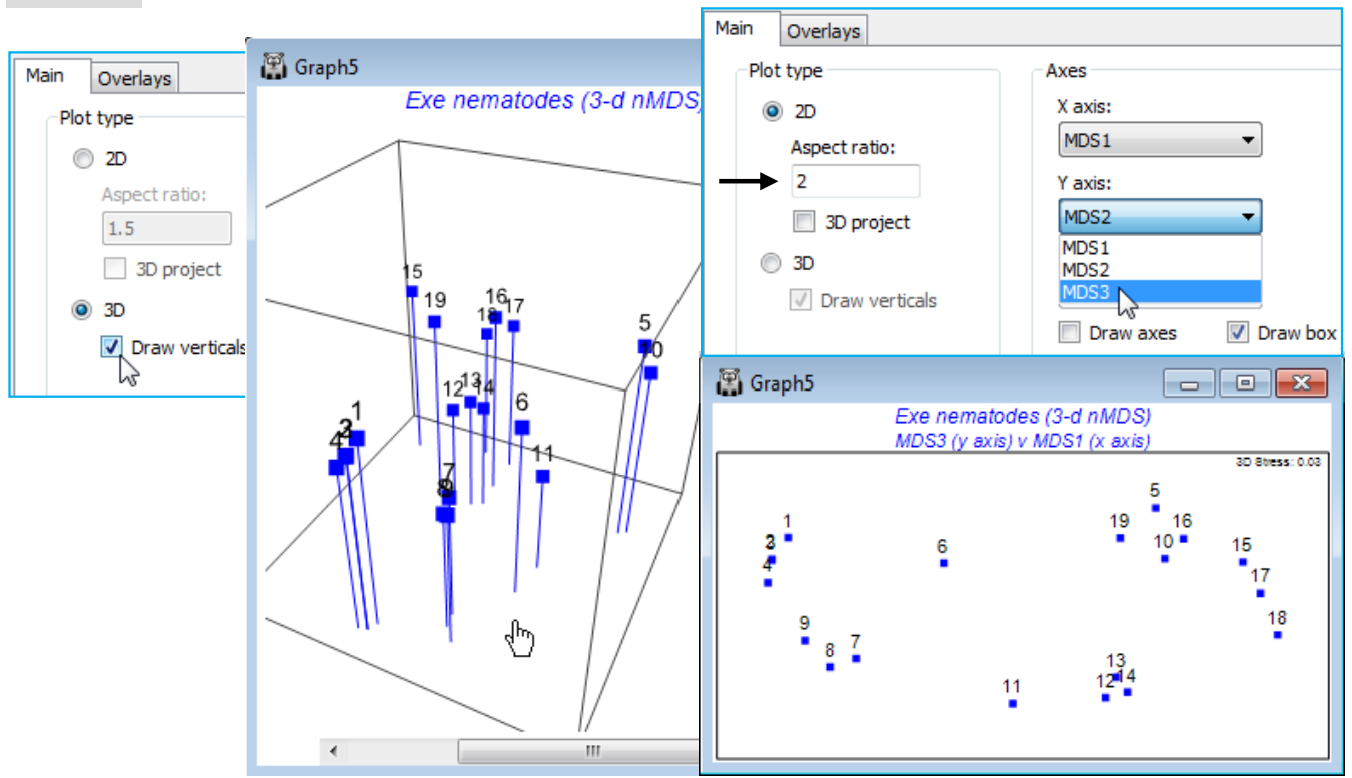
Whilst it is relatively easy to visualise a 3-d plot by rotation of the axes – and PRIMER 7 is now able to output digital video of such rotations (as *.mp4, see below) – it is much harder to produce a convincing 3-d plot for static reproduction in 2-d, e.g. for a printed publication. PRIMER 7 tries to aid this in two ways: by giving any text on the plot a pseudo-perspective, e.g. with site or axes labels shrinking with distance into the plot, and providing an option on the Graph>Special>Main tab to (Plot type•3D)>(✓Draw verticals), which drops vertical lines onto the base plane of the box. For a limited number of samples this might help to fix the relative depths into the plot of the points. Alternatively, 3-d MDS axes could be viewed in 2-d, a pair of axes at a time. This uses, e.g. for the 3-d MDS plot of the Exe data (Graph5), Graph>Special>Main>(Plot type•2D) & (Axes>X axis: MDS1 & Y axis: MDS2) then (X axis: MDS1 & Y axis: MDS3) and possibly (X axis: MDS2 & Y axis: MDS3). It might be sensible to duplicate the first of these plots, with Tools>Duplicate>(•On existing branch) so that two (or all three) of these plots can be viewed together in the workspace. The same idea could be used to generate two or more of the four possible 3-d plots obtainable from the axes of a 4-d MDS (or PCA/PCO), e.g. (X axis: MDS2 & Y axis: MDS3 & Z axis: MDS4), etc.
The plot shown above right (of MDS3 against MDS1) also uses the capacity, noted earlier, to alter the box shape for 2-d plots, by setting (Aspect ratio: 2) rather than the default of 1.5. In fact, rather little is to be gained by a 3-d MDS solution in this case since the 2-d stress of 0.05 is already low, the 3-d solution takes it down only slightly (to 0.03), and the 2-d approximation which the MDS solution represents is unlikely to mislead at all. Save and close the Exe ws workspace.

