ANOSIM for 2-way crossed design with no replication (Exe study)
The 2-way crossed ANOSIM for an unordered factor, and with each combination of the two factors only having a single replicate, is covered in CiMC, Figs. 6.9 to 6.12, firstly for a treatment block design and then for the example considered here of sites crossed with times. This is the inter-tidal Exe estuary nematode study, first seen at the start of Section 6 and used to demonstrate clustering and MDS, but here you should open the full data in a new workspace, i.e. the bi-monthly samples from the 19 sites, Exe nematodes bi-monthly in directory C:\Examples v7\Exe nematodes. It is the 6 seasonal samples, covering one year, which were averaged for each of the 19 sites in the earlier analysis of Exe nematode abundance. That there are clear site differences was obvious from the stark clustering of that data into 4 to 5 groups, but it is less clear whether there are site differences in the largest cluster, sites 12-19. So, as before, pre-treat the full data Exe nematodes bi-monthly with a 4th-root transformation and apply Bray-Curtis similarities, then select sites 12-19 (of course it does not matter whether you make the selection of these sites before or after calculating the trans-formations and similarities). The factors site and time are crossed because the same set of sites is returned to at each time. It is of interest here to test both, separately: are there differences among sites, removing the effect of times, and is there a seasonal effect, removing any site differences?
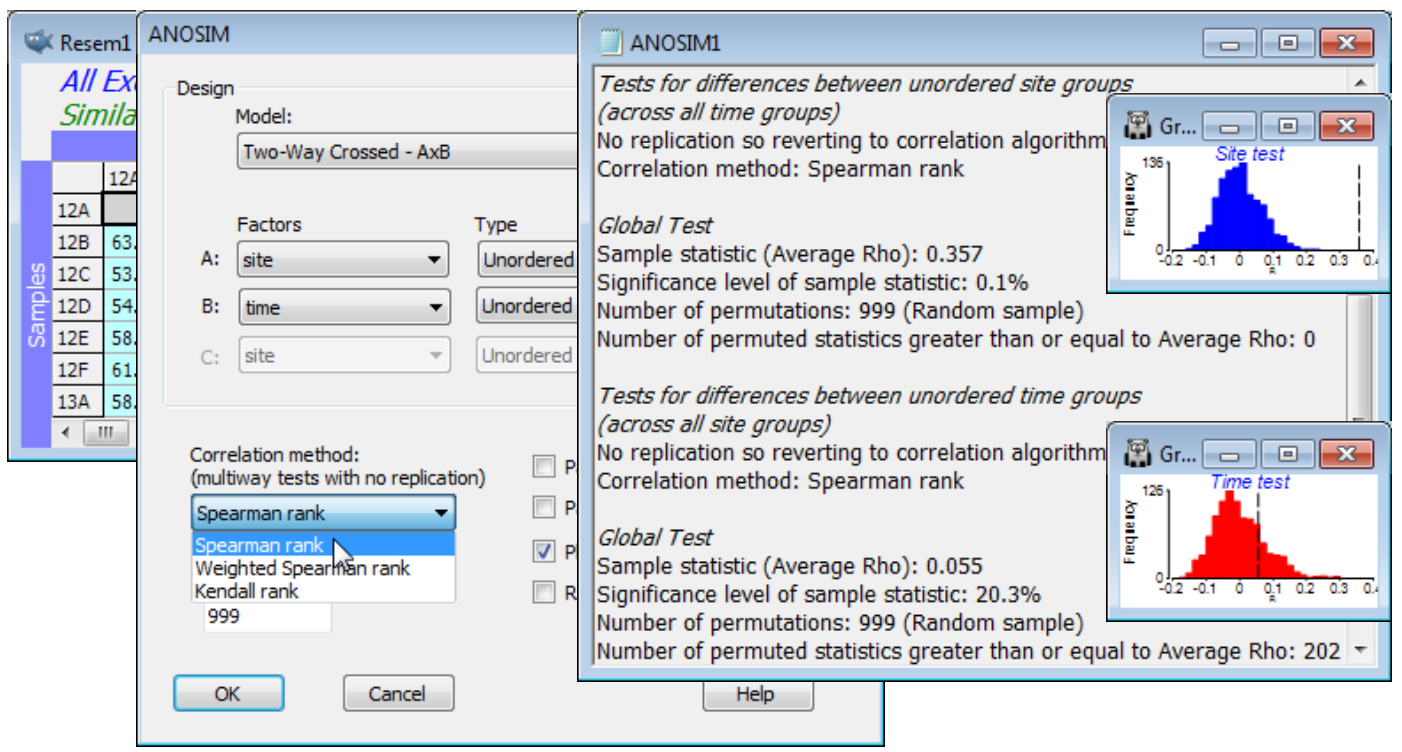
Analyse>ANOSIM>(Model:Two-Way Crossed - AxB)>(Factors A:site & B:time) both Unordered runs a different style of permutation procedure, testing for a site effect by asking whether there is evidence for commonality of the among-site pattern across the different times. For example, if the MDS plots of sites, displayed separately for each time (Fig. 6.12 in CiMC) show the sites grouping in the same way, that must imply there are site differences. To put it the other way round, under the null hypothesis that there are no site differences, the separate MDS plots for each time will have no common pattern and look like random rearrangements of each other. In fact the test operates, as with other ANOSIM tests, on the underlying resemblance matrix (ranks) rather than the MDS plots, and calculates an average of all pairwise correlations ($\rho_\text{av}$) between the among-site resemblance matrices for each time; $\rho_\text{av}$ will be near zero if there are no site effects. (The idea of this correlation $\rho$ between two triangular matrices, a type of non-parametric Mantel statistic, is at the core of most of Sections 13 & 14, and is discussed extensively in Chapters 6, 11, 15 & 16 of CiMC). ANOSIM then recomputes this $\rho_\text{av}$ statistic for random permut¬ations of the site labels at each time (since for the null hypothesis there are no site differences), to obtain a null permutation distribution for $\rho_\text{av}$, and thus a significance test. CiMC, equations (11.3) to (11.4), gives details of the choices offered by the ANOSIM dialog, of rank correlation coefficient $\rho$ to calculate between pairs of resemblance matrices – Spearman rank is the best known and the default. Note that the routine automatically copes with a small number of missing samples (here caused by weather and/or tidal states at one or two sites on one or two occasions) because for each pair of times it can drop the sites which are not found in both configurations (called pairwise deletion of missing values), without having to drop those sites from the whole matrix (called listwise deletion). A satisfactory test does, however, need a decent number of shared sites available for all pairs of times (and for the test to have any power at all, some interactions must be small, otherwise no commonality is detectable – Chapter 6, CiMC).
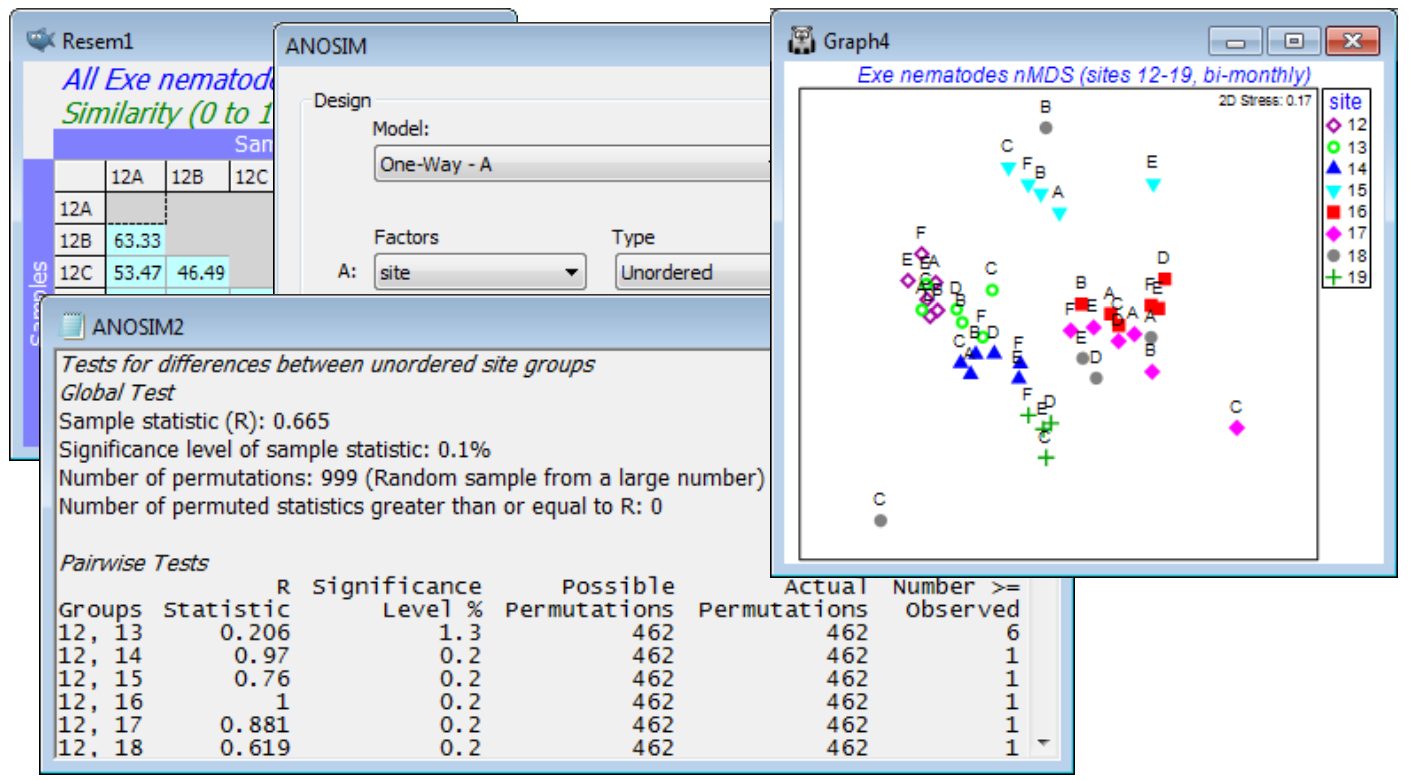
The results show a significant site effect ($\rho_\text{av}$ = 0.36, p<0.1%) but not evidence for a seasonal effect ($\rho_\text{av}$ = 0.06, p$\approx$20%, i.e. the relationships amongst times do not show commonality over all sites, or over sufficiently many of them to depart from random re-arrangement). The latter finding is not so surprising in a climatically mild region, given that generation times of meiofauna are measured in weeks. We might therefore be justified in strengthening the testing procedure for sites by running a 1-way ANOSIM on site, using the full set of 44 samples from sites 12-19, i.e. treating the different times as replicates. Now we can obtain tests between pairs of sites. Such pairwise comparisons are not available with the 2-way crossed analysis (without replicates) for obvious reasons – one cannot ask about commonality of pattern across 6 MDS plots, if each consists only of 2 sites, i.e. a single similarity value! From the 1-way ANOSIM results and the MDS of all samples, it is clear that most sites have significantly different and well-separated assemblages – with the exception of site 18, which is species-poor and has widely scattered replicates (time points) on the MDS, and site 12 vs 13 and site 16 vs 17, with low R values of 0.21 and 0.17 respectively. Close the workspace.


