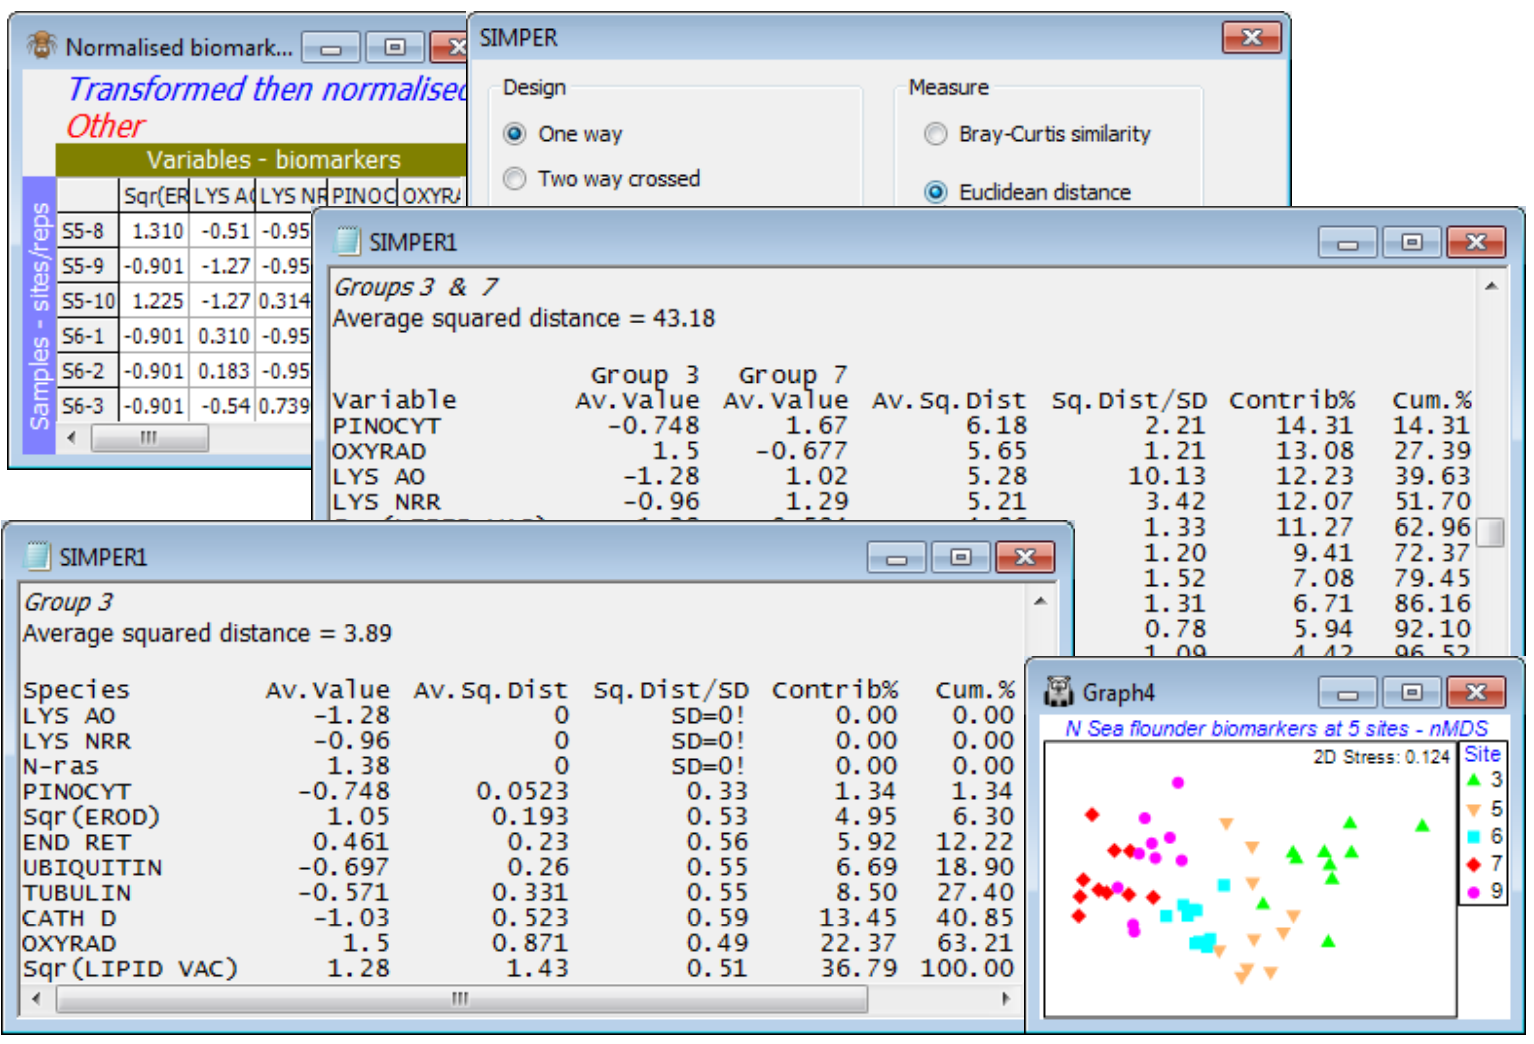
SIMPER on (squared) Euclidean (N Sea biomarkers)
Save and close Tasmania ws and, as a last example, open the recently closed N Sea ws workspace. On the Normalised biomarkers sheet, run Analyse>SIMPER>(Design•One way>Factor A: Site) & (Measure•Euclidean distance), unchecking the box which truncates the listings. The contaminant gradient tends to decline from site 3 (mouth of the Elbe) to 7 and increase on the Dogger Bank (9), and the table comparing sites 3 and 7 gives the highest average Euclidean distance squared from all 11 biomarkers – these are also the two end¬point sites of the gradient seen on the biomarker nMDS plot of Section 9 (and ANOSIM R = 0.99 for 3 vs 7). The normalisation puts all biomarkers on an equi-variable scale so all are likely to contribute something, but Pinocytosis, Oxyradicals and the two Lysosomal stability indices head the list of discriminating variables for these sites (evident also from the coherent variables line-plots recently seen). [The SIMPER breakdown is defined naturally in terms of squared Euclidean distance, not Euclidean itself – eqtn (2.13) of CiMC – but this is not important to PRIMER because ANOSIM tests, nMDS etc all work on ranks of these distances and those are identical between Euclidean and Euclidean squared]. The starting tables in the output that give breakdown of distances within groups are somewhat less natural than they are for Bray-Curtis, (for which both similarity and dissimilarity can be written as a natural sum over species – see eqtns (7.2) and (7.3), CiMC). They are again read from the top downwards, starting with variables which contribute least to the average Euclidean distance (squared) within a group – the key information to scan being column 2. For site 3, having a low average within-group distance (squared) of 3.9 (c.f. 43.2 between sites 3 and 7), the lysosomal stability and Pinocytosis are zero, and N-ras and EROD consistently high for nearly all samples (an indication of impact); these indices fill the top 5 places.

