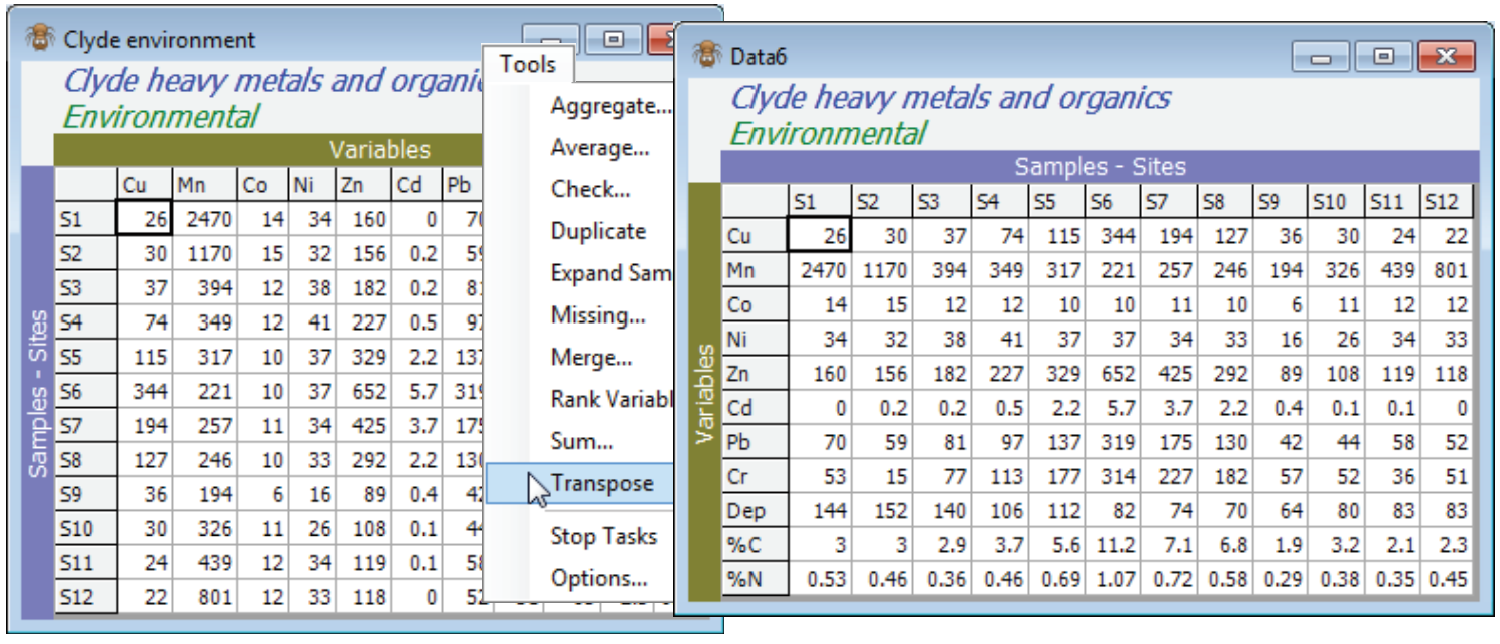
Transposing the datasheet
The Clyde environment sheet has samples as rows and variables as columns. This is the opposite of the ecological matrices typically seen so far, such as Clyde macrofauna biomass, in which rows are the variables (species). The environment matrix is displayed according to the convention in classic multivariate statistics (samples as rows) but ecologists, for good reason, have long chosen to use the transposed form. This is because they often have p (species) > n (samples), whereas classical (normality-based) multivariate methods require n >> p, and it is generally neater to put the larger set of labels into rows (this also suits lengthy species names). It makes no difference to PRIMER which way round the matrices are held, the only important specification being which axis holds the samples (rows or columns?). That is changed by (Samples as•Columns) or (Samples as•Rows) on the Edit>Properties menu and not by transposing the array (so that columns turn to rows and rows to columns). However, a Tools>Transpose operation may sometimes be helpful in displaying a sheet in PRIMER or, more likely, before saving the data to an external file, when another software application needs a particular orientation. Take Tools>Transpose on Clyde environment and note that the Samples/Variables designation also switches.

