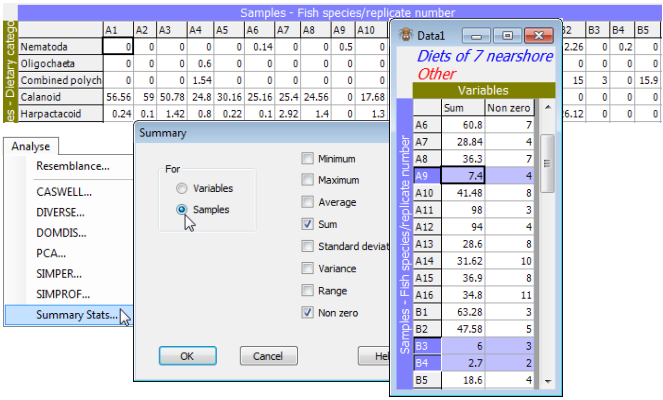
Summary Statistics
File>Open>Filename: WA fish diets %vol, and examine the factors sheet with Edit>Factors. The samples form 7 groups (identified in the labels by A to G) which are the different predator species, three of which, B: Sillago schomburgkii (n = 10), E: Sillago bassensis (n = 14), G: Sillago vittata (n = 16), are from the same genus (congeneric) and thus of particular interest in terms of whether their diets are distinguishable (they occupy different niches in the ‘dietary space’). First, calculate simple summary statistics for each sample with Analyse>Summary Stats>For•Samples. Not all summary options (Min, Max, Average, Sum, Standard deviation, Variance, Range, Non zero) may be meaningful in particular contexts: one that is informative here is ✓Sum. This shows that three samples (A9, B3 and B4) have low total gut fullness (<<10%), even though from a pool of 5 guts, and it is justifiable to look at the effect of (temporarily) dropping these samples from the analysis on the grounds that they contain little information on dietary composition (and could thus have large variability in similarity with other samples, see Section 5 on zero-adjusted Bray-Curtis).

