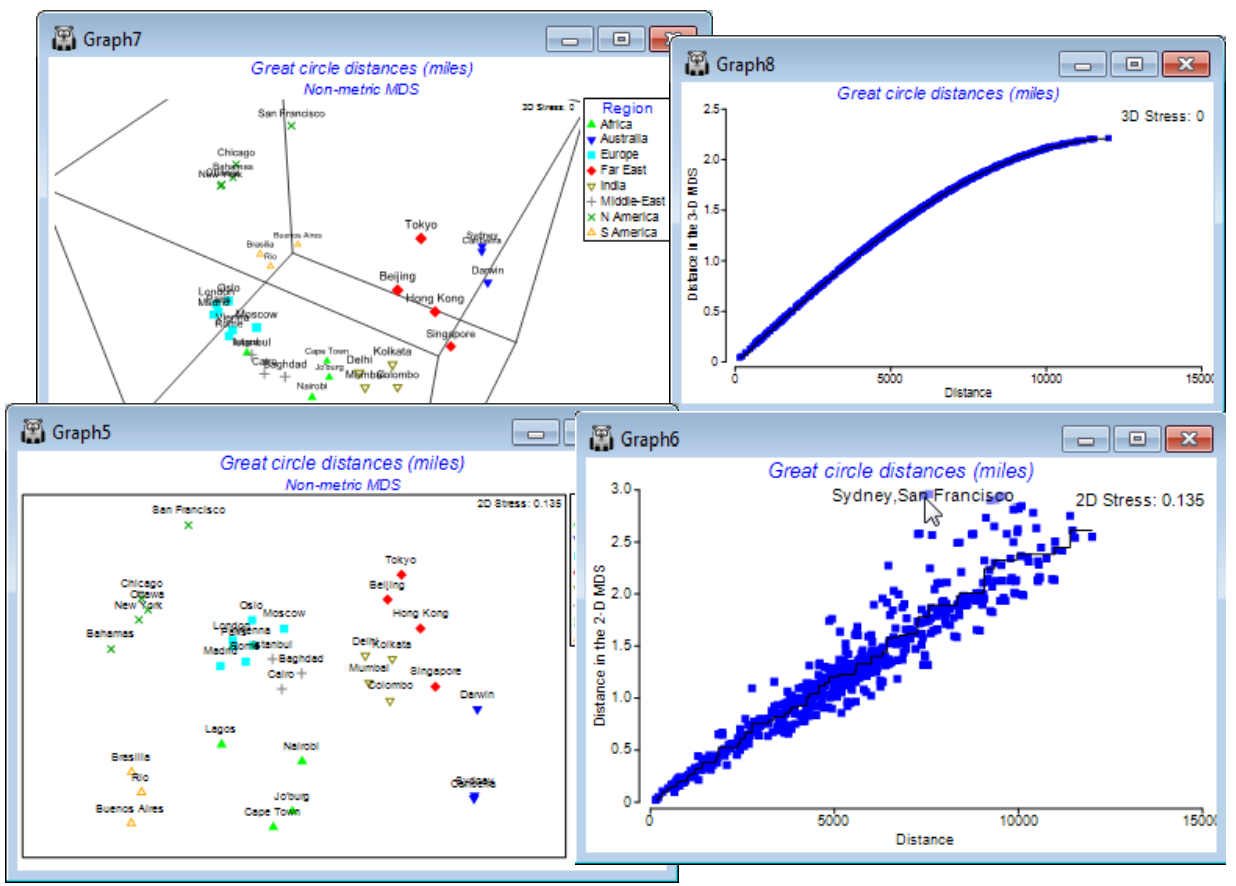
Identifying points on the Shepard plot
Show this by running the matching nMDS to the above mMDS, this time setting (Minimum stress: 0.001). For the 2-d nMDS, identify the greatest contributions to the stress by clicking on outlying points in the Shepard diagram, which then lists the pairs of cities involved, straddled across the point. You can increase the font size of this text, if needed, by e.g. General>Info font>(Size: 120), – this is the button that also controls font size for the stress value shown here and on MDS plots. It is clear that several outliers involve distances to San Francisco, with the MDS attempting to move it closer to Sydney and Tokyo, in keeping with the true distances, whilst maintaining its distance from Europe and Africa etc – an impossible ‘circle to square’ in 2-d, hence the stress of 0.135.

