SIMPROF on a subset of samples
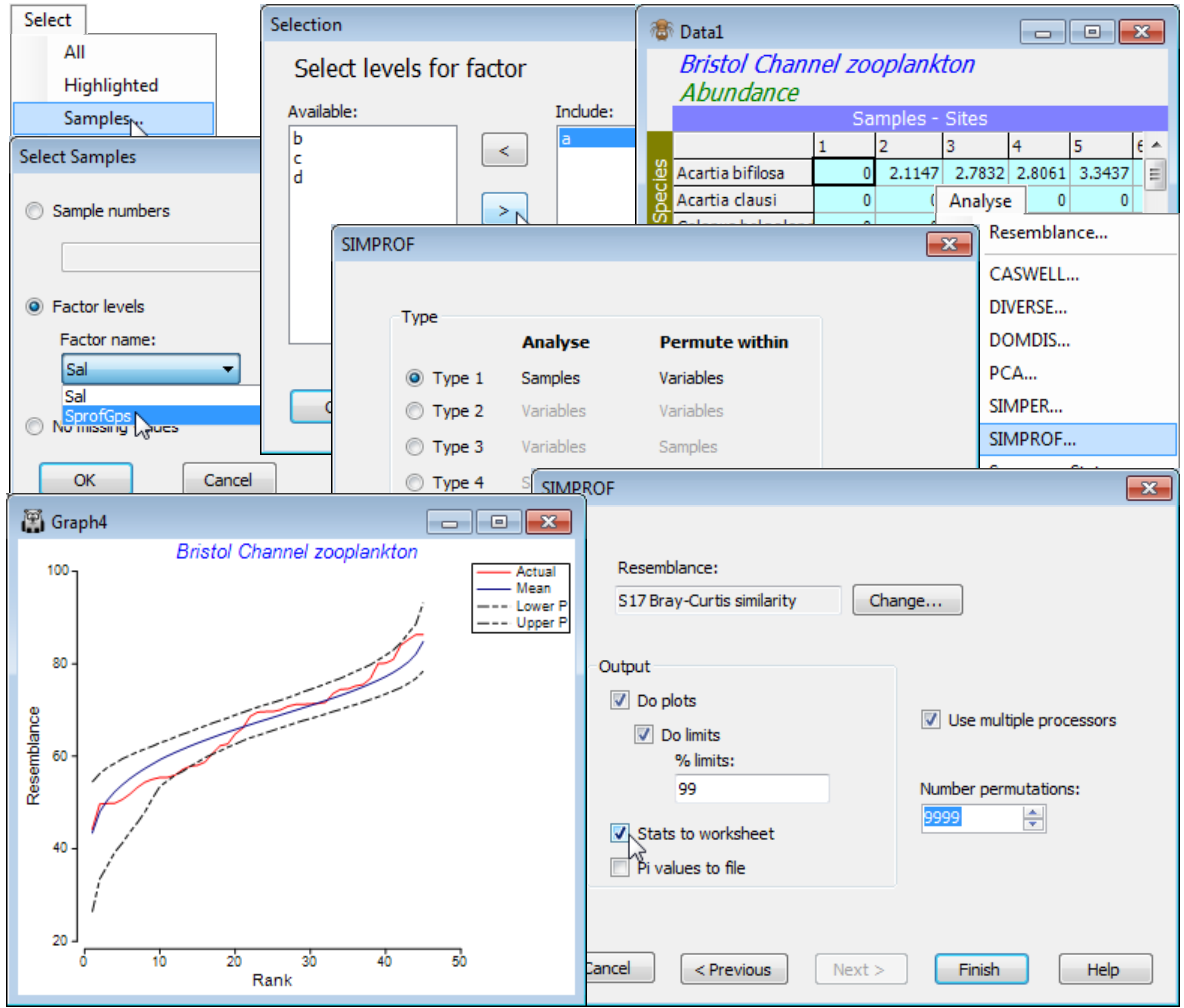
From the Bristol Channel zooplankton transformed data matrix Data1, select (say) the samples of the first of the four groups (a) produced by the above series of SIMPROF tests under CLUSTER, by Select>Samples>(•Factor levels)>(Factor name: SprofGps)>Levels>(Include: a), and with this sheet as the active window, take Analyse>SIMPROF>(Type•Type 1). Take defaults on the next dialog except (Number permutations: 9999) & (✓Stats to worksheet). As already seen, $\pi$= 2.3 and p= 7% for this test but the direct run of SIMPROF gives further graphical information, below.
The previous SIMPROF plot, for the full set of 57 samples, showed an excess of both smaller and larger similarities in the real profile than would be expected by chance, if there were no structure in these data. In contrast, the real similarity profile for this subset of sites 1-8, 10, 12 lies almost fully within the envelope of the 99% limits for the permuted similarity profiles at each rank. Of itself, this juxtaposition of curves is not the test of departure from the null hypothesis; since there are 45 similarity ranks from 10 samples, there is a fair probability that a 1 in 100 event (the probability that a point lies outside its 99% limits by chance) occurs at least once in 45 ‘trials’. Hence the use of a test statistic which is the summed absolute distances, $\pi$, between individual profiles and the mean of the profiles under permutation. If the real profile is further from that mean than 95% (say) of the individual permuted profiles are, then this is evidence to reject the hypothesis of no structure.

