(Tees Bay macrofauna)
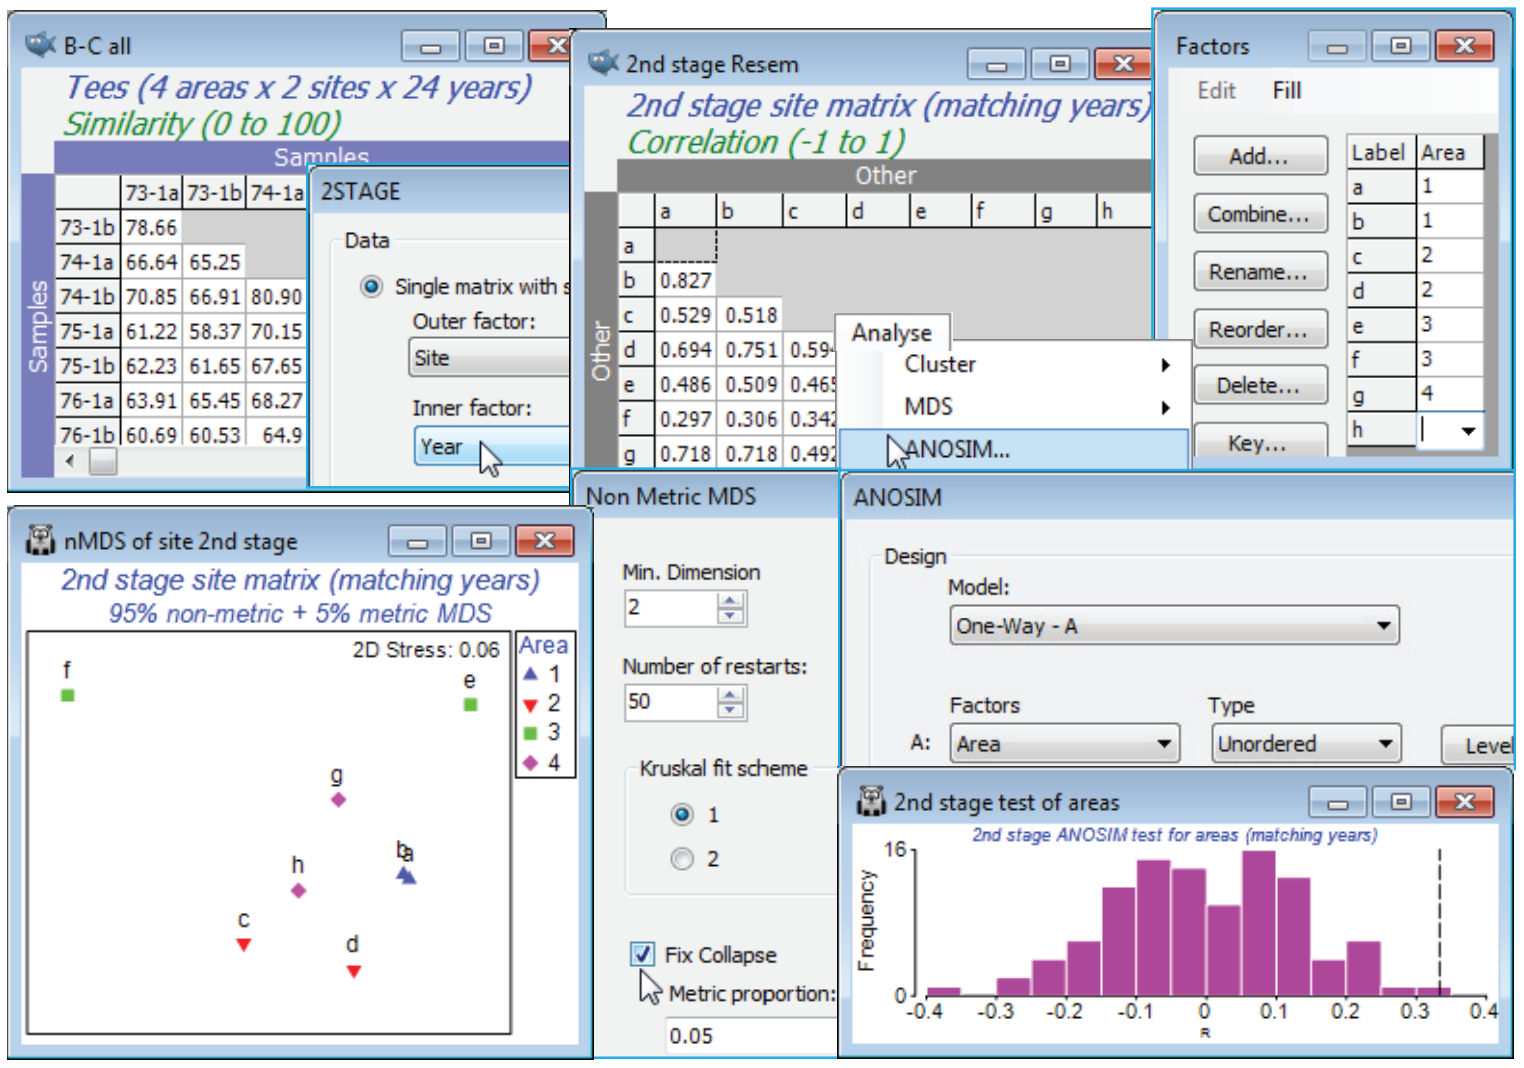
The workspace Tees ws was saved in Section 9; if not available open the data Tees macrobenthic abundance from C:\Examples v7\Tees macrobenthos and recalculate Bray-Curtis similarity on the 4th-root transformed abundances for all 192 samples (B-C all), with structure of 4 areas (1-4) in each of which the same 2 sites (a,b; c,d; e,f; g,h) were sampled in September over 24 years (1973-96), with each sample a pool of a consistent number of benthic grabs. A question of interest here is whether the areas show the same inter-annual patterns – as might be expected if they are primarily influenced by wide-scale climatic variation – or whether local factors, such as the proximity of the plume from the Tees estuary to some areas (with the inevitable local changes in an industrialised estuary) result in different time trajectories in different areas. This can be addressed by calculating, on B-C all, a second-stage matrix for the 8 sites, by Analyse>2STAGE>(Data•Single matrix with sample groups)>(Outer factor: Site) & (Inner factor: Year). On the resulting sheet 2nd stage Resem, set up the simple Area factor (by Edit>Factor>Add) with entries 1,1,2,2,3,3,4,4 – the sites are the replicates – and run 1-way ANOSIM on factor Area, and nMDS plots of the 8 points (you will need the ✓Fix collapse option, Section 8). The ANOSIM is not a test for different assemblages over the areas – that is inevitable given the spatial range – but removes those, and shows that the temporal variations for each area (from different baseline communities) are not the same (R = 0.33, p<1%).

