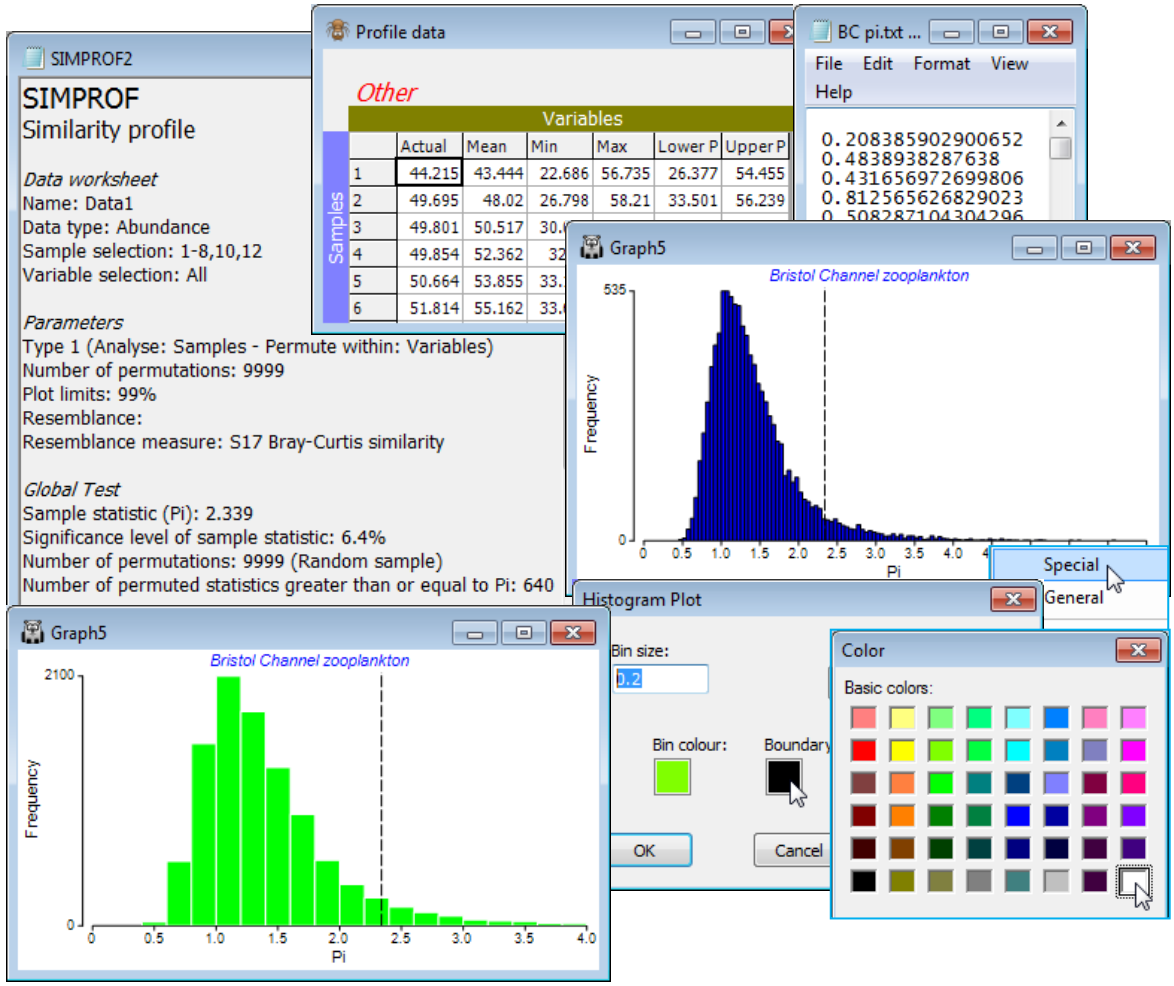
Histograms of null distributions
As in all permutation tests in PRIMER v7 (e.g. in ANOSIM, RELATE, BEST etc), a further output from Analyse>SIMPROF is thus a histogram of the values of the test statistic ($\pi$, here) for the null hypothesis conditions, under permutation, with the real value ($\pi$ = 2.3) also indicated. The relevant $p$ value is given in the SIMPROF results window – not ‘significant’ but borderline here, $p \approx$ 6.5%. Minor variations of both $\pi$ and $p$ values, from those in the results window for the earlier CLUSTER run, are to be expected because the permutations are random – each new run gives slightly different answers. Previously, the default of 999 permutations was selected. If greater precision is needed in significance levels, then the number of permutations should be increased, as here to 9999 (there are a vast number of possible permutations for this particular test). Binomial calculations show that tests with a true p of 5% will return a $p$ in the range (3.5%, 6.5%) with 999 permutations, and in (4.6%, 5.4%) for 9999 permutations – this is true for all tests employing random permutations.
As previously seen (Section 4) with direct plotting of histograms, via Plots>Histogram Plot, the Special menu (right click when over the plot) allows changes to bin width, colour, axis scales etc. A final option on the SIMPROF dialog (✓Pi values to file) is to export the $\pi$ values from all the permutations to a text file (*.txt). This is not commonly used but is again an option with most permutation tests in PRIMER; e.g. it would allow the user to redraw the null distribution histogram of $\pi$ with other software, or perhaps examine its parametric form etc.

