(Bristol Channel zooplankton)
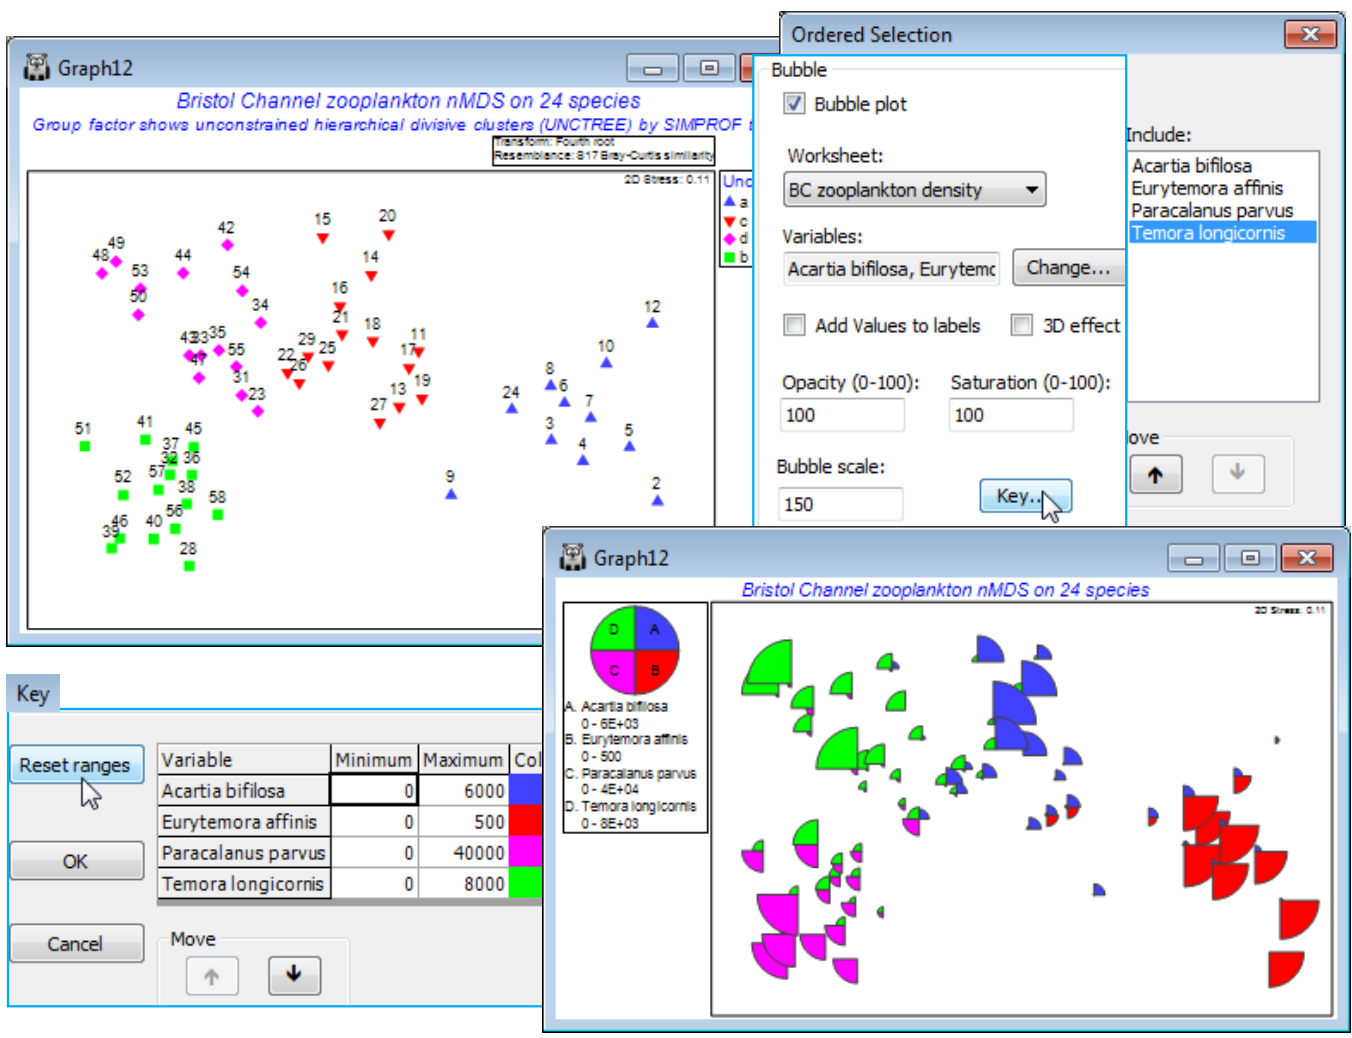
The BC zooplankton density data sheet in C:\Examples v7\BC zooplankton was used in the last half of Section 6 to illustrate different clustering methods, and the workspace Bristol Channel ws may be available from that. If not, open the data, fourth-root transform it, compute Bray-Curtis similarities and construct an nMDS plot. SIMPROF tests in Section 6 produced 4 groups, broadly similar for all clustering methods, and these look convincing in the nMDS below, and in Fig. 3.10 of CiMC, though it is equally clear that they form part of a continuum of change. A shade plot and SIMPER analysis (Section 10) identify four species which most typify the clusters (Acartia bifilosa, Eurytemora affinis, Paracalanus parvus and Temora longicornis) and are good discriminators between them – these are shown on a segmented bubble plot below. The focus here is simply on observing how the actual densities for these key species vary over the site gradient (this is largely salinity driven). So, whilst the nMDS is computed on heavily transformed scales, the raw densities themselves are plotted as the bubble segment sizes, requiring different scaling, varying over an order of magnitude (or nearly two). This is in contrast to the previous example, where the focus was on identifying species actually contributing to the nMDS pattern, and for which common scaling of the transformed counts was then more appropriate.

