S estimators
PRIMER therefore includes a number of S extrapolators – attempts to predict the true total number of species that would be observed as the number of samples tends to infinity (the asymptote of the species accumulation curve), assuming that a closed community is being successively sampled. This should not be confused with the (✓UGE) or permuted (✓S) curves which, like rarefaction indices, look backwards at the expected behaviour of S as samples are removed, and return simply the observed S at the end of the series. There is a choice of six extrapolators, each of which is calculated as every new sample is added, so the result is again a curve, of the evolution of the S predictor as sample size increases (though mostly one would use the end point prediction as the best estimate of the asymptote). Where the samples are entered in permuted orders, the predictions are again the average of the 999 estimators at each step. These are not parametric approaches, depending on simple functions of the number of species seen only in 1 or 2 samples (Chao2, Jacknife1 and 2), or the number of species that have only 1 or 2 individuals in the entire pool of samples (Chao1), or the set of proportions of samples that contain each species (Bootstrap). The only parametric model given is Michaelis-Menton, which returns (more appropriately, in PRIMER 7!) the predicted asymptote of a hyperbola fitted to the cumulative S curve at each step.
The literature on S estimation is large, and PRIMER does not attempt a comprehensive approach. An early and influential summary for ecologists is Colwell RK & Coddington JA 1994, Phil Trans Roy Soc B 345: 101-118, who detail the above estimators, and an excellent software package for serious users in this area is Colwell’s ‘EstimateS’ (http://viceroy.eeb.uconn.edu/estimates/).
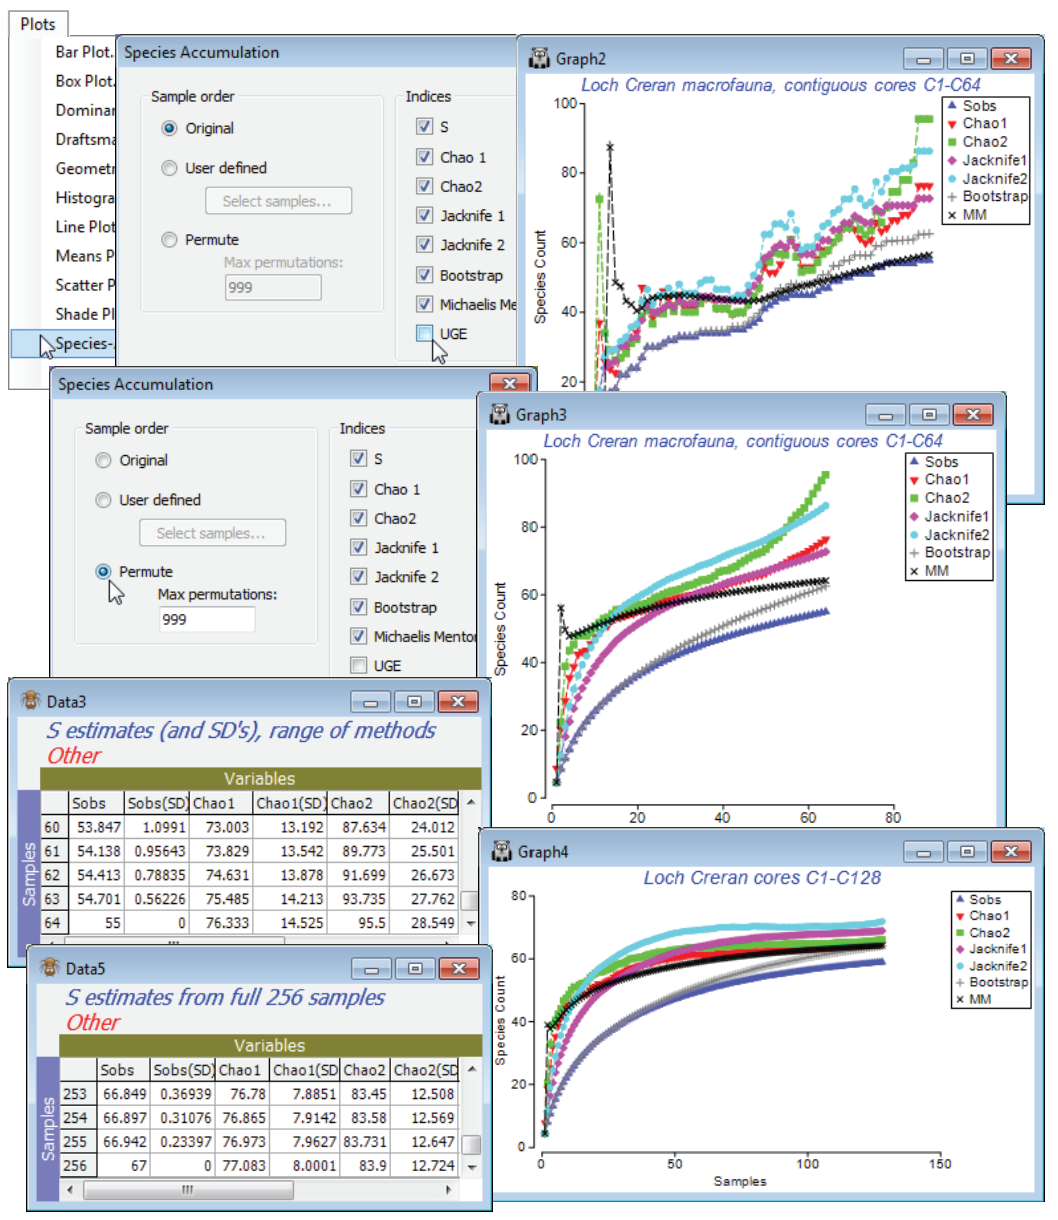
So, produce these six differing S estimates with Plots>Species Accum Plot from samples 1-64 in the Creran macrofauna counts sheet, in two ways: with the samples in their original order and run again with (Sample order•Permute)>(Max permutations: 999), unchecking (✓UGE). In addition to the plots, there is a worksheet of the numeric estimates at each step, which includes (in some cases) simple standard errors based on the permutations – but some of these are certain to underestimate the true degree of uncertainty in practice. (Of course, determining the true number of species not seen is an essentially unsolvable problem without strong assumptions about closed communities and catchability by the sampling device, which in a marine context can be doubtful – accumulation curves rarely approach asymptotes quickly). Check the estimates made at 64 samples against the number of species observed in 128 samples and, run again at that level, against the total S for the full set of 256 contiguous cores. Has an asymptote effectively been reached? Close the workspace.

