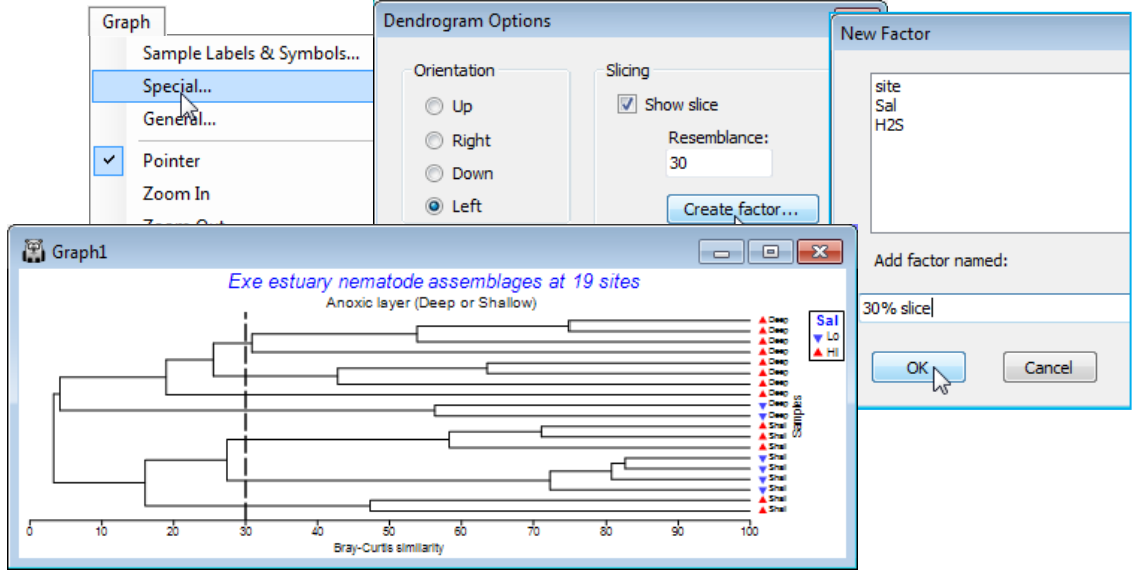
Special menu for slicing & orientation of dendrograms
Unlike Graph>Samples Labels & Symbols or Graph>General, which take you to the Graph Options dialog box, which is displayed in consistent format for these and other appropriate tabs (Titles, X axis, Y axis, Keys), the Graph>Special menu item takes you to a specific dialog box applicable only to that type of plot – here a Dendrogram options dialog. This allows selection of orientation, e.g. Graph>Special>(Orientation•Left), and a slice drawn through the diagram at a specified resemblance, e.g. by Slicing:(✓Show slice)>(Resemblance:30) & (Create factor>Add factor named:30% slice). This creates a factor, levels (a, b, c, ..), of the groups given by that slice.
The newly created factor resulting from the plot will again be back-propagated to any previous data sheet on its direct branch, so whilst it could be utilised to accentuate the clustering structure in this dendrogram, by applying it as the symbols, a more profitable use might be for symbol display on an MDS plot (Section 8), to judge the extent of agreement between clustering and ordination of the same data, under the same resemblance measure. Save the workspace as Exe ws, and close it.

