Cophenetic correlation
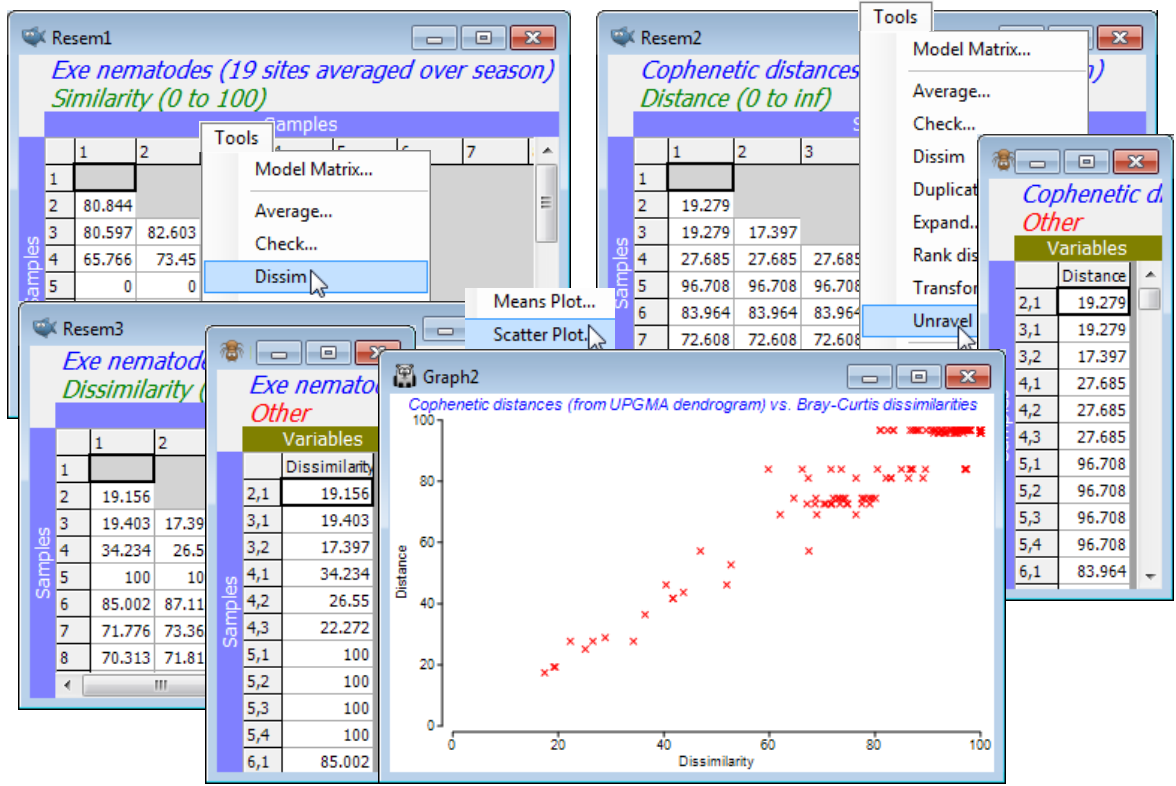
The dendrogram is displayed in a plot window, and a separate Results window gives a detailed list of the precise similarities at which the groups combine, for this agglomerative method. This also now gives the cophenetic correlation (0.958 here), which is a Pearson matrix correlation between the entries of the original dissimilarity matrix and the (vertical) distances through a dendrogram between the corresponding pairs of points (the cophenetic distance matrix). The closer this Pearson correlation is to 1 the more nearly the dendrogram accurately represents the relationships among the samples in the original (dis)similarity matrix. The concept of matrix correlations is central to several of the PRIMER methods, e.g. in Sections 9, 13, 14 & 17, but is usually computed on the ranks of the two matrices, thus becoming a Spearman matrix correlation. The Analyse>RELATE routine in PRIMER 7 now offers Pearson as well as rank-based correlations, so that having taken the option to create the cophenetic distance matrix in the CLUSTER dialog, you could now verify the cophenetic correlation by running RELATE (Section 14) between that distance matrix and the Bray-Curtis dissimilarities. More usefully, you could visualise the relationship by Tools>Unravel on both matrices and Plots>Scatter Plot, as seen under Unravelling resemblances in Section 5.

