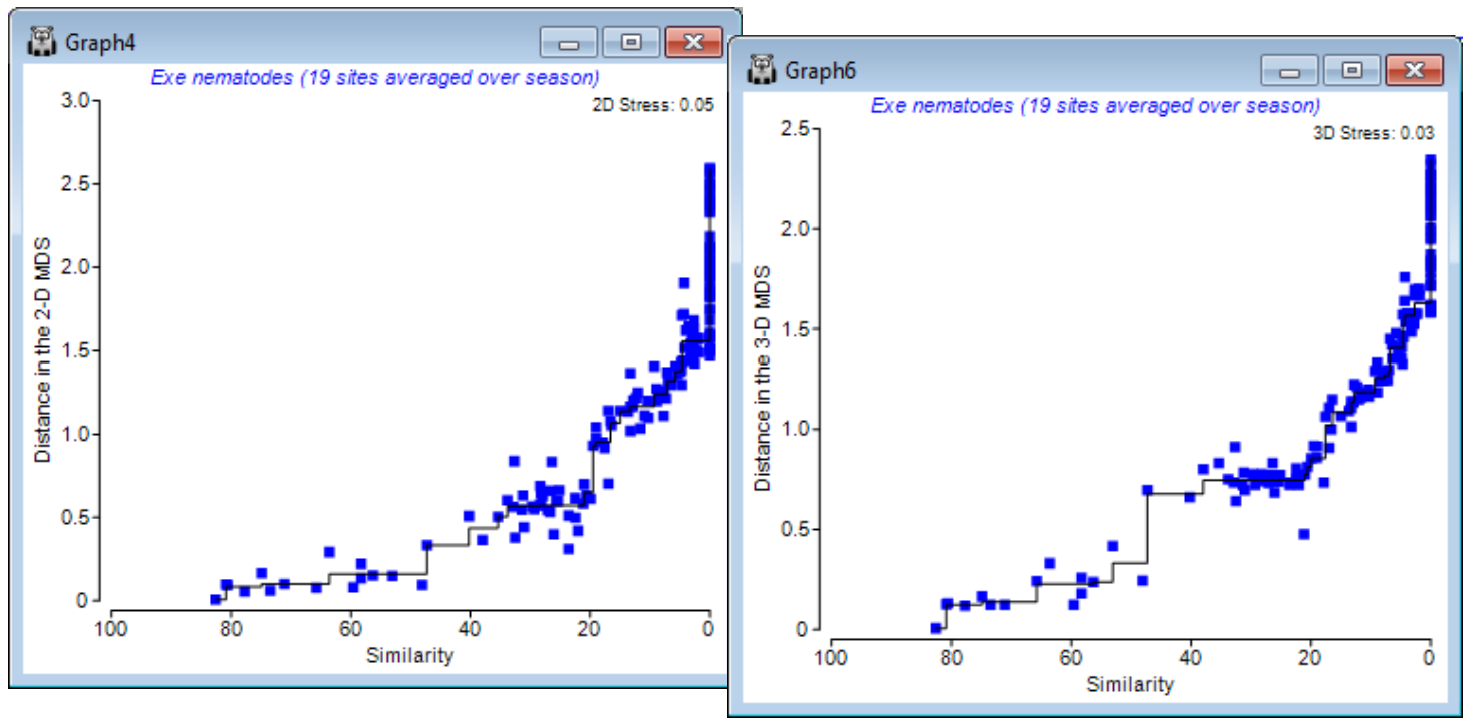
Shepard diagrams
That the stress is low here is also evident from the Shepard diagrams for the 2-d and 3-d solutions (possibly Graph4 & Graph6). They are scatter plots of distances between samples in the ordination against original (dis)similarities, in which the deviations of the points (blue) from the from the best-fitting monotonic increasing regression line (black) are seen to be very low. When all points lie on the line, all statements of the following form are true: ‘site 5 is closer to site 10 in the ordination than site 14 is to site 6 because the dissimilarity between sites 5 and 10 is smaller than that between 14 and 6’, i.e. rank order relationships are exactly preserved and stress is zero. Note the regression does not need to be linear (through the origin) as in mMDS, and it is certainly not so here: sites 14 and 6 are twice as dissimilar (~ 90%) as sites 5 and 10 are (~45%) but they are not placed twice as far apart in the plot (as mMDS would try to force). This capacity to shrink/stretch the dissimilarity scale in conversion to a distance is what gives nMDS its flexibility.

