Bubble key
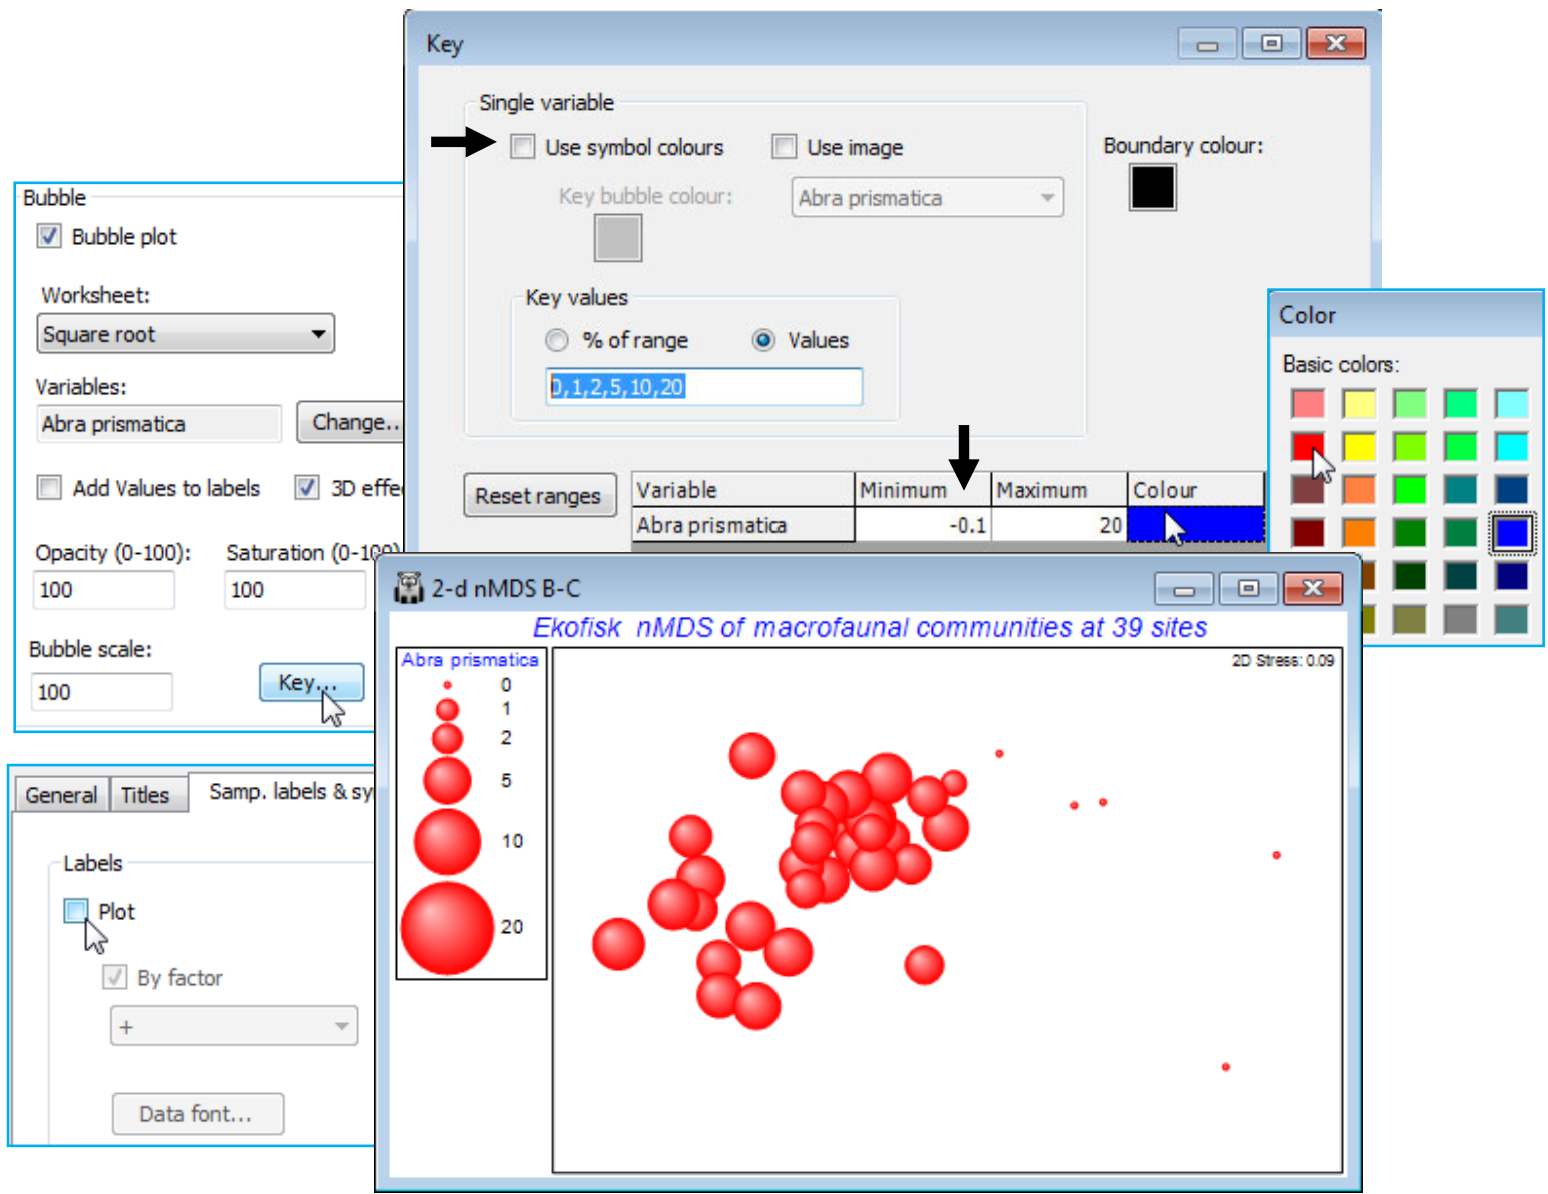
The key to the left of the plot, which gives the root-transformed scale for Abra prismatica counts, has been defined automatically and may not therefore be optimal – the values, and even the number of categories, are now (in PRIMER 7) user-selectable. The smallest non-zero value can only be 1 (the square root of 1) because the original data are integers, so a circle category of size 0.7 in the key is artificial, and not seen in the plot. We shall want to replicate this bubble plot ordination for several species, on a common size scale, to judge respective contributions to the observed nMDS pattern. Given that the maximum value in the transformed sheet, Square root, is somewhat over 20, for Chaetozone setosa – use Analyse>Summary Stats>(For•Variables) to see this – a natural key would have (square root) sizes 1, 2, 5, 10 and 20 (counts 1, 4, 25, 100 and 400). Take Key in the Bubble section of the Graph>Special>Main dialog box, run on the above 2-d nMDS B-C plot, change to (Maximum 20) and, under Key values, (•Values 1,2,5,10,20). The (Key bubble colour:) can be changed from its neutral grey by clicking on the grey box, to give the usual colour choice dialog, but this is not often likely to be advantageous because a less neutral colour would become confused with the colour codes for (symbol) groups A-D, if these are being employed (as above). However, given that the a priori grouping of these sites into distance ranges is a rather arbitrary categorisation of a likely continuous scale of impact and therefore response of the biota, e.g. with steadily increasing dilution of contaminants, it might be preferable to plot bubbles without this categorisation, by unchecking the (✓Use symbol colours) box on this Key dialog. The bubbles default to the standard blue symbol colour, but this can be changed in the (Colour $\text{\hspace{8mm}}$ ) cell – this automatically changes the key to the same single colour. (The boundary colour for circles – only used when the 3D effect is not selected – can similarly be changed, from black, on this dialog).
Note that the plot below also changes back to the defaults of (Opacity: 100) & (Bubble scale: 100), from the Special>Main tab, and edits the title, removes the subtitle and the history box, from the General tab. And it employs a generally neater way of indicating the position of sites on the MDS where this species has a zero value. The ‘+’ labels are removed, using the Samp. labels & symbols tab, and the Minimum cell on the Bubble Key dialog is set to a small negative number (here -0.1) instead of 0, ensuring that a tiny bubble is plotted at all sites. There is no risk of confusion in this case because there are no very low non-zero values, the lowest square-root count being 1, but this could be made doubly clear by adding zero to the Key values, i.e. using (•Values 0,1,2,5,10,20).

