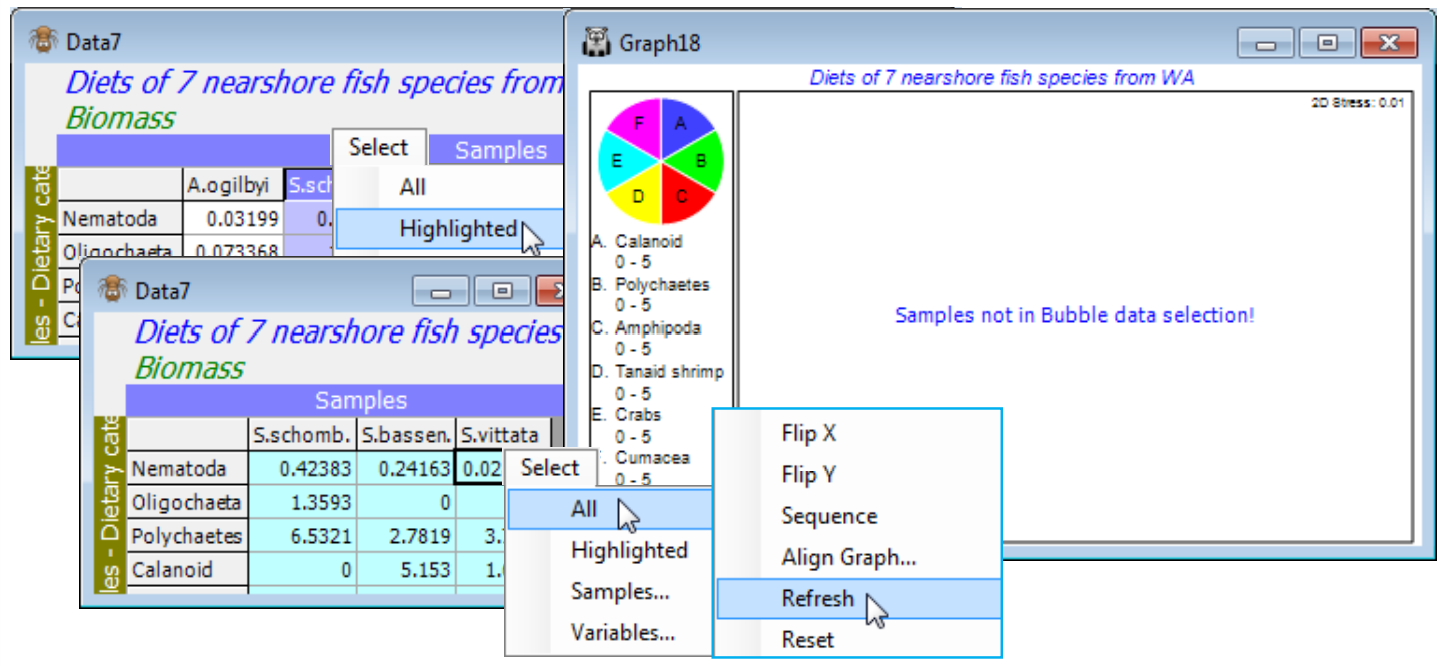
Bubble data selection error & Refresh
It is worth repeating the point made at the start of these examples on bubble plots: if the routine cannot find one or more of the sample labels of the MDS points in the supplied secondary data sheet of bubble values, you will get a blank graph with the message Samples not in Bubble data selection!, or if it cannot find the worksheet at all, Bubble data worksheet is missing! These are quite common error messages. The latter may arise because, while the secondary data sheet was correctly supplied and used to create the bubble plot initially, it was subsequently deleted or, more likely, had a name change. You will not identify this until the bubble plot window is shut down, perhaps as a result of saving and closing the workspace. When it is reopened, the MDS plot will display the error because it can no longer find the linked sheet name it was initially given. More subtly, the Samples not in Bubble data selection can occur because the secondary data sheet has, subsequent to creating the bubble plot, been subjected to a selection of its samples (for some other purpose), and left in that state, so that some of the MDS points cannot be matched in the current selection. If this is the problem, then Select>All on the secondary sheet will solve it, but note that when returning to the MDS plot, the error message is only removed by either shutting the window down (with  ) and reopening it or, more neatly, by Graph>Refresh.
A general point to note is that though all the overlays given above (trajectories, bubble, vector plots etc) have been applied to nMDS plots, with only minor exceptions they are generic and available in any ordination configuration plot, e.g. PCA (Section 12), PCO and CAP (in the PERMANOVA+ add-on to PRIMER) and metric MDS (mMDS), which we now describe.

