LINKTREE (Messolongi lagoons data
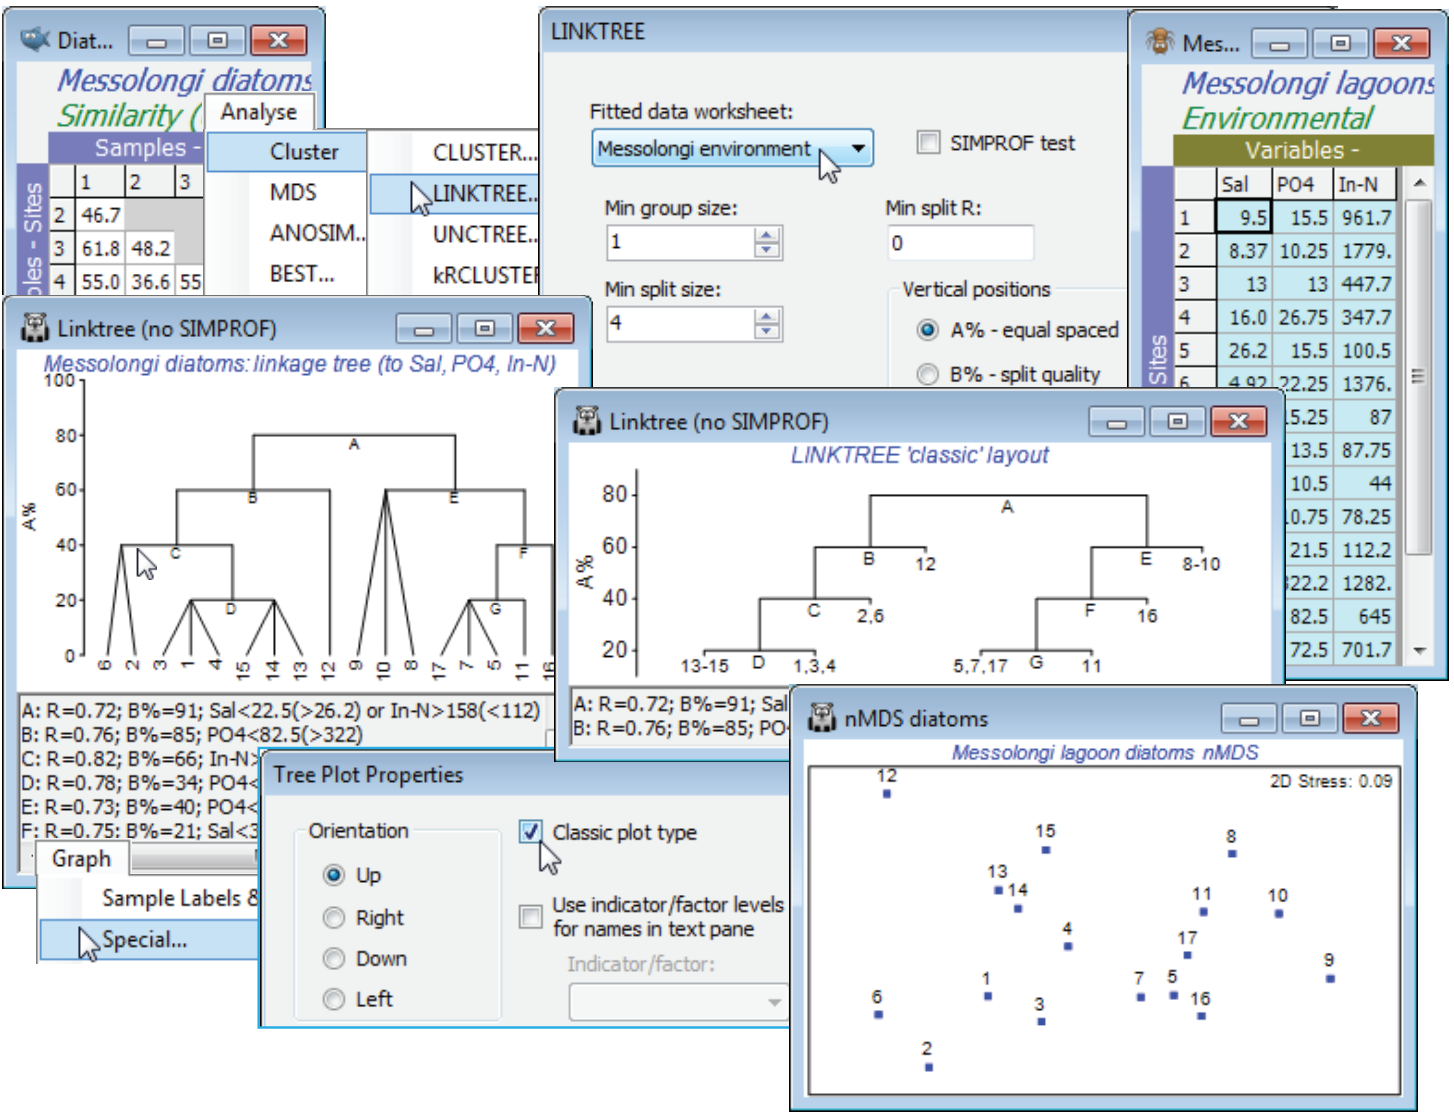
Continuing the lagoon diatom study, having first selected (highlighting then Select>Highlighted) the optimal 3-variable set (Sal, PO$_4$, In-N), from the above BEST run, in Messolongi environment, and again with the diatom resemblance matrix as the active sheet (not the abiotic data, as in earlier PRIMER versions), take Analyse>Cluster>LINKTREE>(Fitted data: Messolongi environment) & (Min group size: 1) & (Min split size: 4) & (Min split R: 0) & (Vertical positions•A%), and uncheck the (✓SIMPROF test) box for this run. These conditions determine that a group of size 3 will not be divided but that groups of size 4 or more will be, if R exceeds 0 (though a minimum split value of 0 effectively means that this last condition will never come into play). Such stopping rules are arbitrary and inferior to SIMPROF tests, seen next. (Note that since transforms change nothing, the original form of the abiotic matrix is preferred, for ease of interpreting the scales. Of course, normalisation is not required either, since abiotic variables are no longer combined).
The output is a tree diagram with a text pane below it. The first split (A) in the assemblage data is between sites 1-4, 6, 12-15 (left hand side of the biotic MDS plot shown above, from earlier) and 5, 7, 8-11, 16, 17 (right hand side) – a very natural divide in the ordination (though remember that the procedure works in the high-dimensional space not the 2-d MDS). This has ANOSIM R = 0.72. It is characterised by low or high salinity (Salinity<22.5 to the left, and >26.2 to the right). Note that the inequalities in the text pane (repeated in the results window) are always in this order, with the branch to the left first and the branch to the right following, in brackets. It follows that if the tree is rotated, by clicking on a horizontal bar exactly like a CLUSTER dendrogram, then the inequality in the text pane reverses (the reason for a dynamic text pane rather than just a static results window). Alternatively, the same split A of samples is obtained by choosing In-N>158 to the left and <112 to the right. R is the same whichever variable is used, of course – both can ‘explain’ that biotic split so both are reported. Moving down the left of the tree, the next split (B) divides sites 1-4, 6, 13-15 from site 12, with an R of 0.76, on the basis of PO$_4$ (high phosphate at site 12). Then C splits 2, 6 from 1, 3, 4, 13-15 at R = 0.82, again with two explanations (and convincingly on the MDS), etc. The end result is 8 groups of sites, each determined by a series of abiotic inequalities. Note that R has no tendency to decline/increase on moving down the tree – the ranks are recalculated for each new subset of samples. An absolute measure (B%) which does generally decline with finer group distinctions was given in Section 6 for the analogous UNCTREE plot. This can be used as a y axis for the plot (see over); the A% scale just displays arbitrary equal-spaced steps but that can help the clarity of the ‘classic’ form of linkage/regression tree plot, which is also shown above, and is an option on the Special menu for linkage plots. This menu also allows the plot to be re-oriented, as for a dendrogram, and can replace long variable names in the text pane with short indicator levels.

