User creation/ manipulation of multi-plots
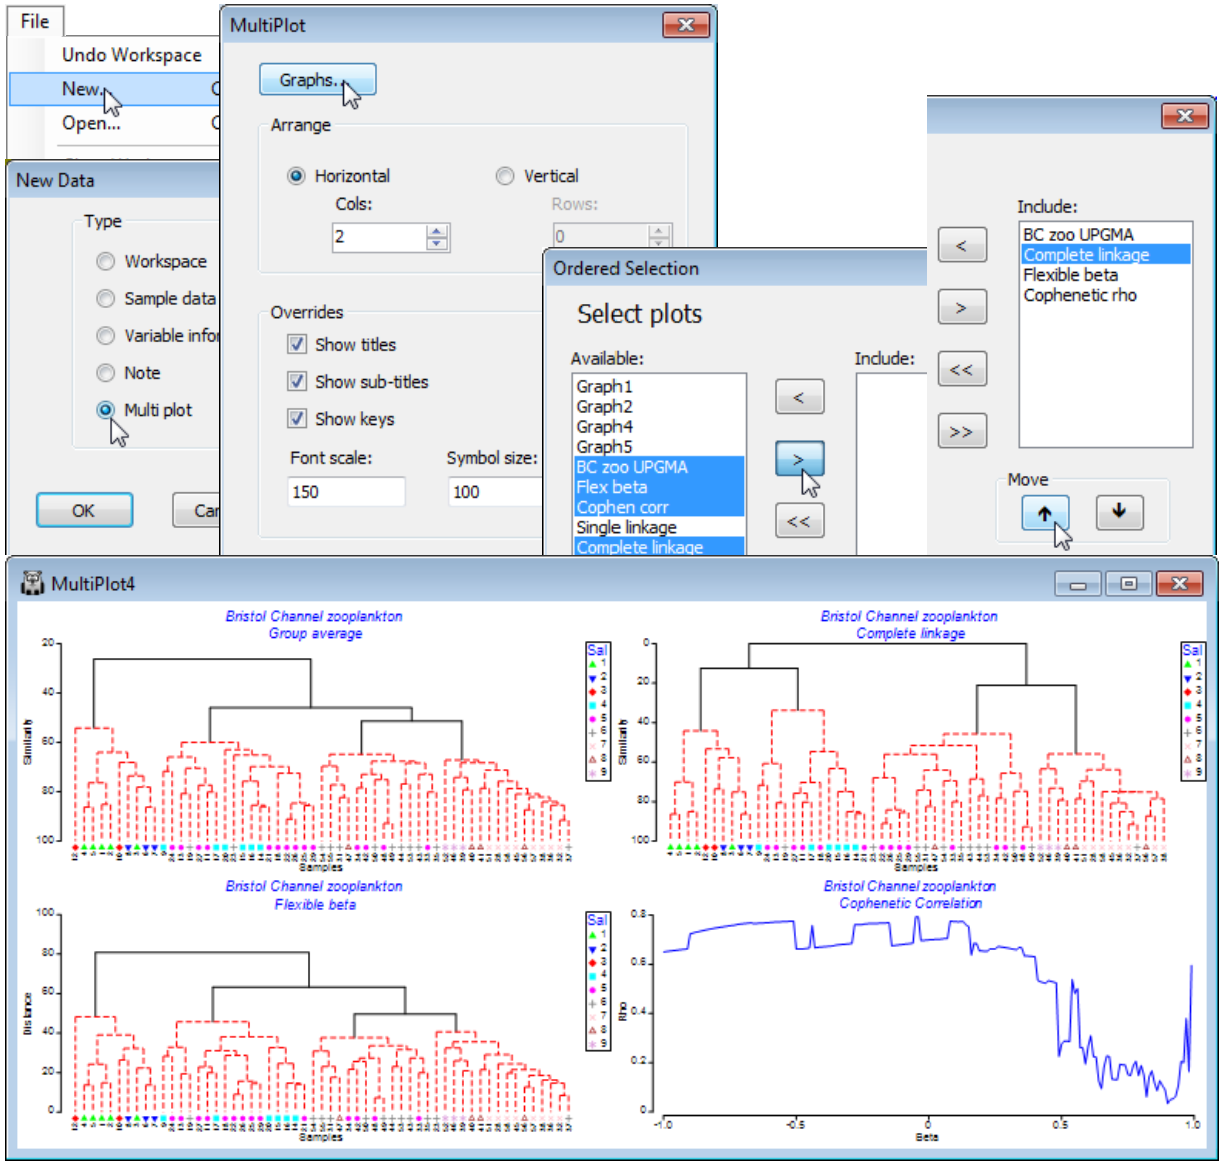
In addition to automatic generation by certain routines, multi-plots can be created and populated by the user, to hold sets of related plots in a single composite window. File>New>(•Multi plot) gives a dialog box headed by a Graphs button which allows an ordered selection from the windows for most of the single plot types in the workspace (for a contiguous set from the Available list, click on the first and last name whilst holding down the Shift key, or for a non-contiguous set, on individual names whilst holding down the Ctrl key, in standard Windows fashion). Then move them to the Include list with ![]() and re-order them in the required sequence with the
and re-order them in the required sequence with the ![]() and
and ![]() arrows. This sequence is followed either in horizontal rows or vertical columns with the choice of arrangement being chosen in the Multiplot dialog box. Given that the component plots can be of different types, the options for global change of features applying to all plots is inevitably limited. However, this dialog box – which can also be returned to from a completed multi-plot using Graph>Special – does allow for global setting of overall font and symbol sizes (where not limited to fit sample axes, as in the example below) and global suppression of main titles, sub-titles and keys. Clicking on individual plots in the multi-plot returns the active window to that specific graph, allowing the usual full range of changes to be made to all its properties. When this window is closed (
arrows. This sequence is followed either in horizontal rows or vertical columns with the choice of arrangement being chosen in the Multiplot dialog box. Given that the component plots can be of different types, the options for global change of features applying to all plots is inevitably limited. However, this dialog box – which can also be returned to from a completed multi-plot using Graph>Special – does allow for global setting of overall font and symbol sizes (where not limited to fit sample axes, as in the example below) and global suppression of main titles, sub-titles and keys. Clicking on individual plots in the multi-plot returns the active window to that specific graph, allowing the usual full range of changes to be made to all its properties. When this window is closed (  ), the multi-plot is again the active window and incorporates those changes (unless globally overridden).
The workspace Bristol Channel ws from C:\Examples v7\BC zooplankton should still be open, and it would be advisable to change the various dendrogram plot windows to more recognisable names, reflecting the different linkage methods, e.g. Complete linkage or Flexible beta (the linkage method can be found in the results window above each plot). Create a multi-plot with File>New>(•Multi plot)>(Arrange•Horizontal>Cols: 2) & (Font scale: 150) & Graphs, including the group average (UPGMA), complete and flexible beta dendrograms and the latter’s cophenetic plot, in that order. The plots will be placed in a 2-column stack (thus of 2 rows), with the order reading horizontally.

