(Tikus Island coral cover)
Data on coral communities at a site in Tikus Island, Thousand Islands, Indonesia, over the years 1981, 83, 84, 85, 87 and 88, were reported by Warwick RM, Clarke KR, Suharsono 1990, Coral Reefs 8: 171-179. Ten replicate transects were examined each year, and the data is the length of intersection of a transect (as a percentage of transect total length) by each of the 58 coral species identified, file Tikus coral cover in directory C:\Examples v7\Tikus corals. The region was subject to a coral bleaching event in 1982 (probably El Niño related), so that the 1983 samples are very denuded of live coral – this is a classic situation in which a zero-adjusted Bray-Curtis similarity is likely to be useful, and this example is discussed in detail in the Clarke et al 2006 paper mentioned above. A dummy value of 1 is a natural choice here because the smallest non-zero entries for each species are about 1%, or marginally less. To see these entries, highlight the whole array, take say Pre-treatment>Transform(individual)>(Expression:V-10*(V=0)) and enter the resulting sheet to Analyse>Summary Stats>(For•Variables)&(✓Minimum). This works because the BASIC syntax expression computed on the value V in every cell, V-10*(V=0), returns either -1 (true) or 0 (false) for V=0, multiplies this up to -10 or 0, so when subtracted from V returns +10 in any cell which is zero and leaves non-zero values alone. Summary Stats then finds the minimum for each species. (10 in the expression could be replaced by any large number). If you run the Summary Stats again, this time (For•Samples)&(✓Minimum) you will get the lowest non-zero entry in the whole matrix.
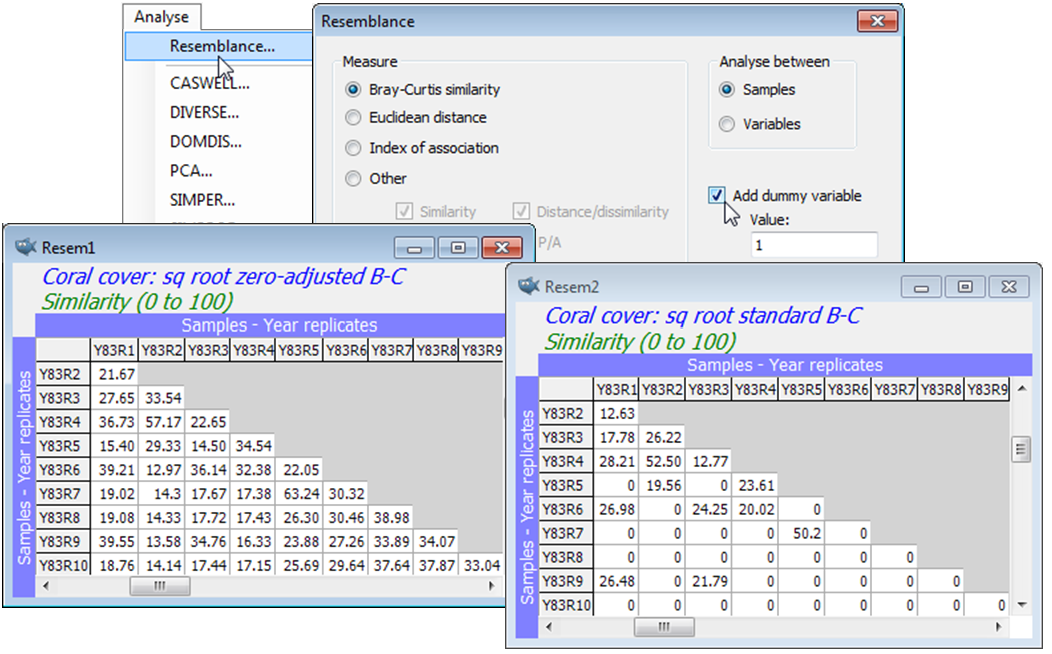
As in the previous section, Plots>Shade Plot readily shows that a (mild) square root transform is necessary to avoid the resemblance calculation being dominated by just a couple of species with occasionally very large %cover values. So, after Pre-treatment>Transform(overall)>Square root, take Analyse>Resemblance>(Measure•Bray-Curtis similarity) & (Analyse between•Samples) & (✓Add dummy variable>Value: 1), this dummy value of 1 being equally suitable after any power transformation or reduction to presence/absence (1/0). By repeating this calculation on the square-rooted data, but without the dummy variable, a quick glance at the two resemblance matrices shows the dramatic effect of the zero-adjustment here, e.g. among the 1983 replicates. (This translates into substantial differences in the clustering, MDS ordination, ANOSIM tests etc, see Fig. 16.7, CiMC). File>Save Workspace As>(File name:Tikus ws) in the C:\Examples v7\Tikus corals directory.


