SIMPROF method
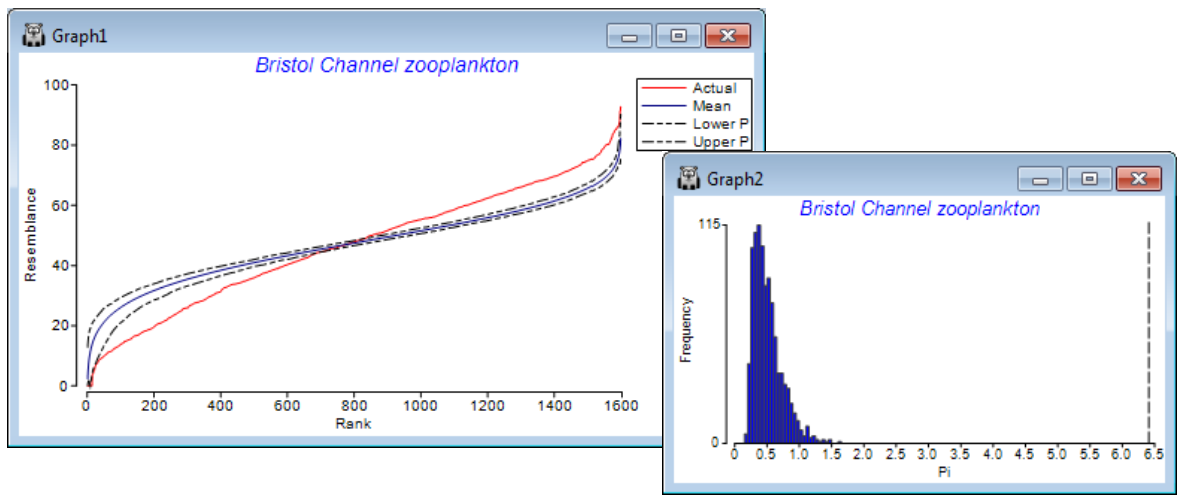
The similarity profile test (SIMPROF), Clarke KR, Somerfield PJ, Gorley RN 2008, J Exp Mar Biol Ecol 366: 56-69, is a permutation test of the null hypothesis that a specified set of samples, which are not a priori divided into groups, contain no multivariate structure to further examine. (Do not confuse this with the ANOSIM test, Section 9, which tests prior group structures of times, sites, treatments etc). The SIMPROF procedure, usually a sequence of SIMPROF tests, is used extensively in PRIMER to provide stopping rules for all the clustering methods: unconstrained sample clustering in this section (and Chapter 3, CiMC p3-6); species (or more general variable) clustering into coherent response curves in Section 10 (and the start of Chapter 7, CiMC); and biotic sample clustering constrained by thresholds on environmental variables in Section 13 (and Chapter 11, CiMC p11-13). The similarity profile itself is the set of resemblances among all pairs of the specified samples, ranked from smallest to largest, and the ordered resemblances then plotted (y-axis) against their rank (x-axis). The departure of this curve from its ‘expected’ shape under the null hypothesis is the basis of the test. For example, if there is genuine clustering within a set of biotic samples, there will be many more smaller similarities and larger similar¬ities than if all the samples came from the same community (and therefore all had intermediate similarities to each other). The ‘expected’ profile is obtained by permuting the entries for each variable (e.g. species) across that subset of samples, separately for each variable, thus producing a ‘null’ condition in which samples can have no real structure. Such simulations realistic¬ally fix the variable values, e.g. to have the same pattern of rare and common species, with the same counts, as the real matrix, and thus require no assumptions about the differing forms the distributions of abundances may take for the differing species. The random rearrangements are repeated a large number of times (under user control), producing many ‘expected’ profiles under the null, for which the average and percentile (say 95% or 99%) values at each rank are plotted along with the real profile. A typical real profile, with mean and 99% limits from the permuted profiles, for all 57 samples of the data below, now follows (on left; see later for the routine which constructs these plots, under SIMPROF direct run).
The summed absolute distances ($\pi$) between the real similarity profile and the simulated mean profile is the test statistic. A second set of simulated profiles are then generated and $\pi$ computed between each of these and the mean profile (from the first set). This defines a range of likely values of the test statistic $\pi$ under the null hypothesis (above histogram, right), and the real $\pi$ (dashed line, far right) is compared to this to give a p value, as for any test, given as a percentage (see stages in permutation testing, Chapter 6, CiMC). Here the real $\pi$ is the most extreme of 1000 arrangements of the matrix (999 permuted and one real one), hence $\rho <$ 1 in 1000 (0.1%) and the null is rejected – there is structure. The SIMPROF procedure in CLUSTER separately repeats this test on the two sample clusters at the next level down, and so on until no further significant results are obtained.

