(Bermuda macrofauna ); Caswell’s neutral model
Soft-sediment macrofaunal assemblages (along with meiofauna and biomarker suites) were studied at 6 sites in Hamilton Harbour, Bermuda (labelled H2, H3, H4, H5, H6, H7) during an international IOC workshop on the effects of pollutants in sub-tropical waters (Addison RF & Clarke KR, eds 1990, J Exp Mar Biol Ecol 138). There were 4 replicates at each site, giving a data matrix of 24 samples from 64 species, in the data file Bermuda macrofauna counts in directory C:\Examples v7\ Bermuda benthos. These data will be used to illustrate computation of another diversity index, not now widely used (the validity of its assumptions being questionable for most assemblages) but which has been available in PRIMER from early versions and therefore retained for consistency.
Analyse>CASWELL generates V statistics for the Caswell neutral model, and is discussed in Chapter 8 of CiMC. It is essentially a comparison of Shannon diversity H$^{\hspace{2pt} \prime}$ with the value it would be expected to take, conditional on the observed number of species S and individuals N, under some simple model assembly rules for the community, which are ecologically neutral, in the sense defined by Caswell H 1976, Ecol Monogr 46: 327-354. The normalised form of H$^{\hspace{2pt} \prime}$ (subtract the modelled mean and divide by the modelled standard deviation) is the V statistic, positive values of V implying greater diversity than neutrality and negative values lesser. (There is an F test of its departure from V = 0, though this is not very convincing because it also depends on the neutral model assumptions, which are unrealistic for typical assemblages). The algorithm implemented here is due to Goldman N & Lambshead PJD 1989, Mar Ecol Prog Ser 50: 255-261.
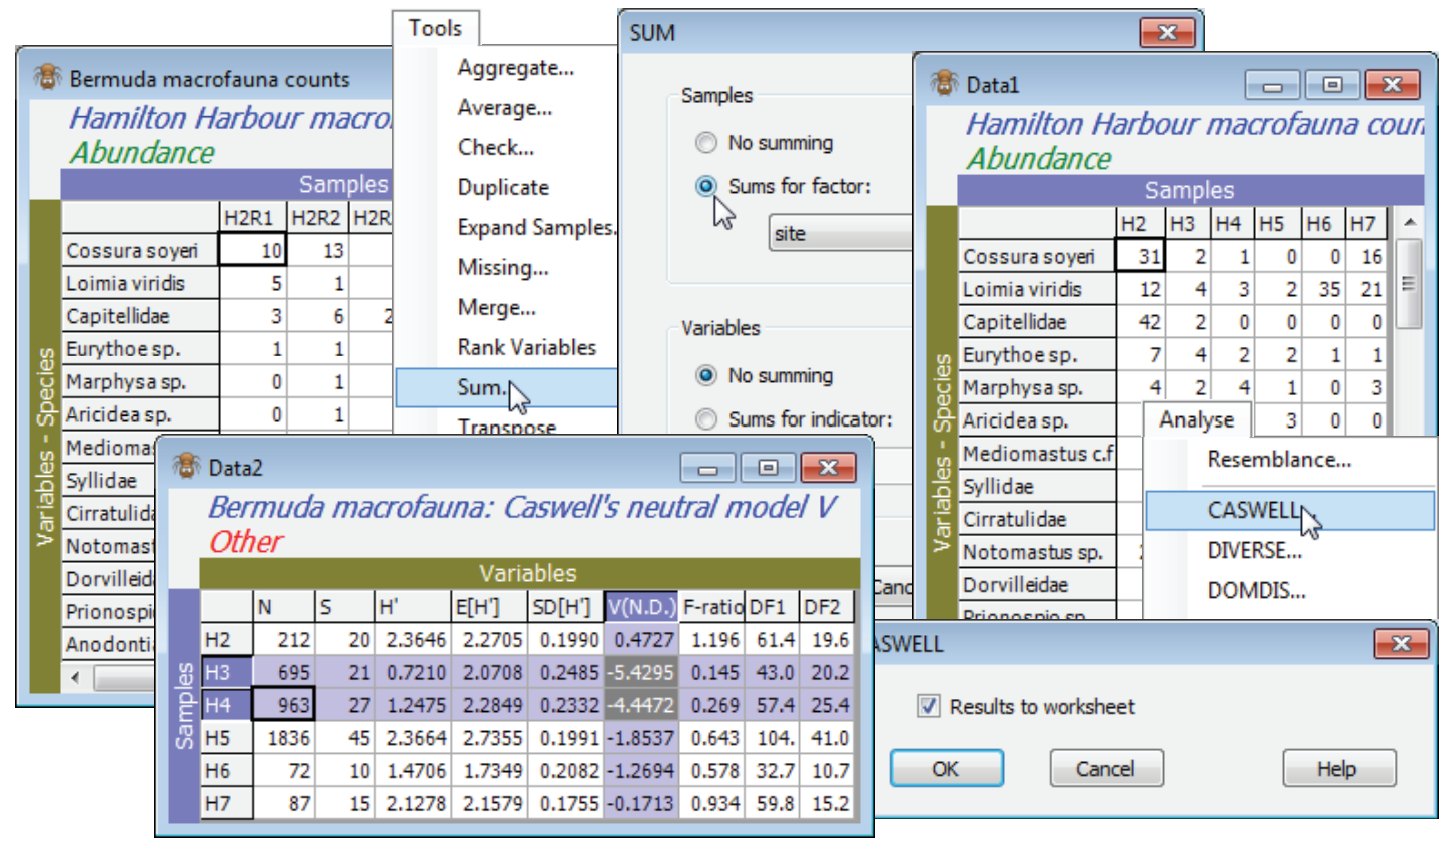
Recreate the Caswell example in Chapter 8 of CiMC, for the Bermuda macrofauna counts by firstly summing across the replicates, to increase the sample size, with Tools>Sum>(Samples•Sums for factor: site) & (Variables•No summing). This is justified because there is equal replication at each site – Tools>Average would not be appropriate for a Caswell calculation because the entries are no longer real (integer) counts. Note that V could alternatively be calculated for each replicate, as for the diversity measures above, and this would allow standard means and confidence intervals based on variance estimates from replication, rather than the (less robust) internal variance estimate from the neutral model. On the summed Data1 take Analyse>CASWELL>(✓Results to worksheet), and the V values for each site (and the accompanying test calculations) are found in the resulting Data2 sheet, which can be manipulated, saved etc as with any other data matrix. Sites H3 and H4 are seen to have H$^{\hspace{2pt} \prime}$ well below expectation under the neutral model (V statistics of -5.4, -4.5 respectively). Close the workspace – it will not be needed again.

