Running an nMDS (Exe nematodes)
From the directory C:\Examples v7\Exe nematodes, File>Open the workspace Exe ws, last seen in Section 6, of the sediment nematode communities at 19 inter-tidal sites in the Exe estuary. If this does not exist, open the data file Exe nematode abundance(.pri) in a clear workspace, and re-run the UPGMA clustering, with Pre-treatment>Transform (overall)>Transformation: Fourth root and Analyse>Resemblance>(Measure•Bray-Curtis similarity)&(Analyse between•Samples), then Analyse>Cluster>CLUSTER>(Cluster mode•Group average), and on the resulting dendrogram, Graph>Special>(Slicing✓Show slice)>(Resemblance: 30)>Create factor>(Add factor named: 30% slice). The Bray-Curtis similarity matrix is in Resem1 and the dendrogram Graph1.
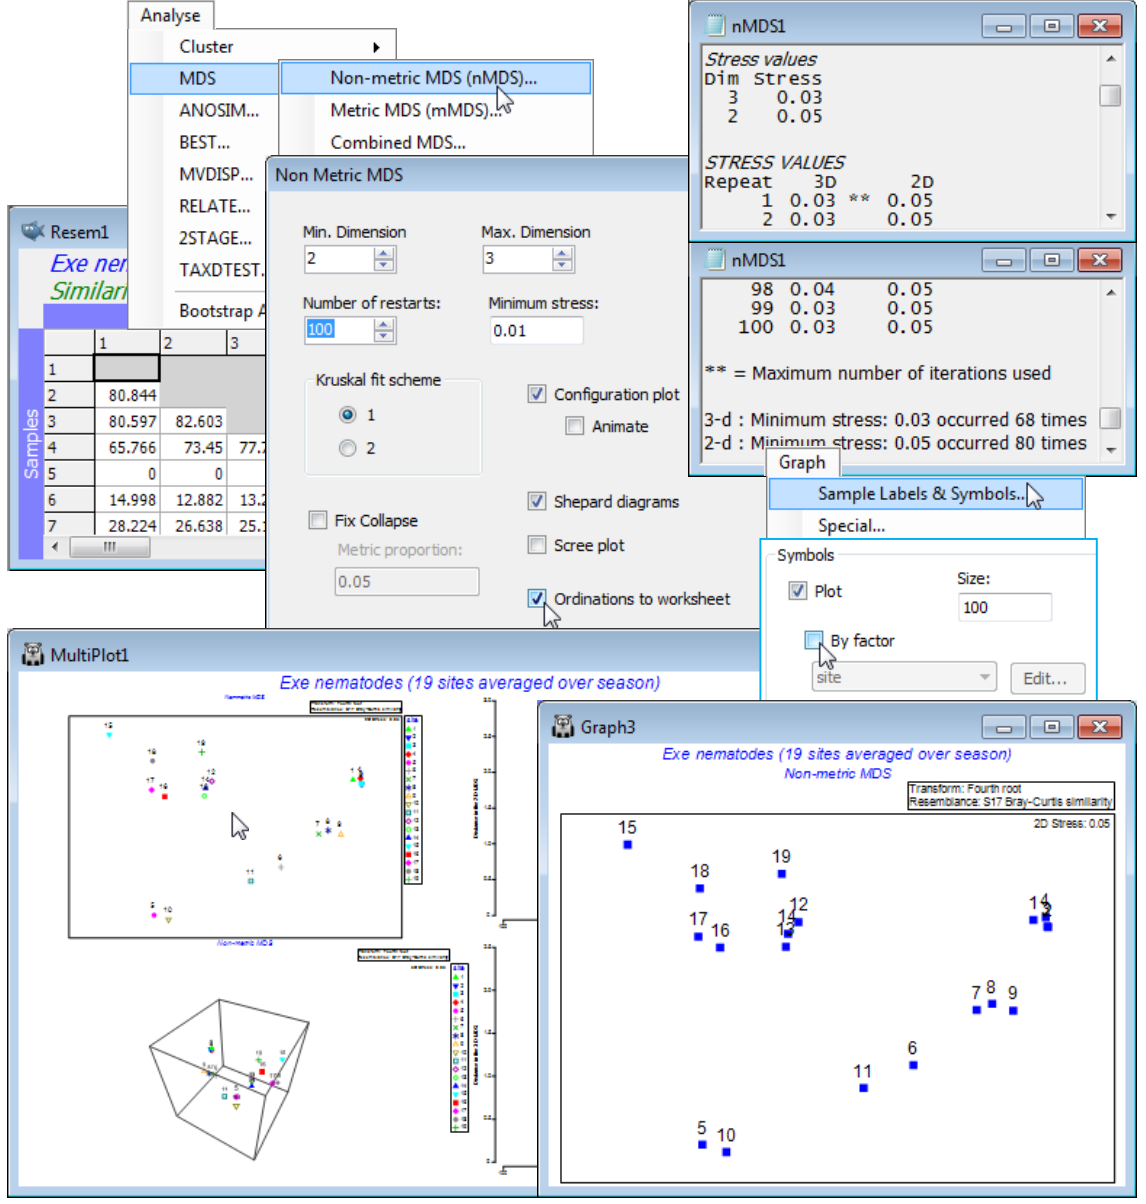
With Resem1 as the active window, take Analyse>MDS>Non-metric MDS (nMDS) and options of (Min. Dimension: 2)&(Max. Dimension: 3)&(Number of restarts: 100)&(Minimum stress: 0.01) &(Kruskal fit scheme•1)&(✓Configuration plot)&(✓Shepard diagrams)&(✓Ordinations to work sheet) leaving the other boxes unticked for now. The outcome is a results window, nMDS1, and a multi-plot MultiPlot1 which, if unrolled in the Explorer tree (either by clicking the ![]() in the tree or by clicking on any of the plot components in the multi-plot), shows four plot windows, probably named Graph3 to Graph6. For the first one, remove the spread of symbols with Graph>Sample labels & symbols, unchecking (Symbols>By factor), to leave just the labelled default symbols.
in the tree or by clicking on any of the plot components in the multi-plot), shows four plot windows, probably named Graph3 to Graph6. For the first one, remove the spread of symbols with Graph>Sample labels & symbols, unchecking (Symbols>By factor), to leave just the labelled default symbols.

