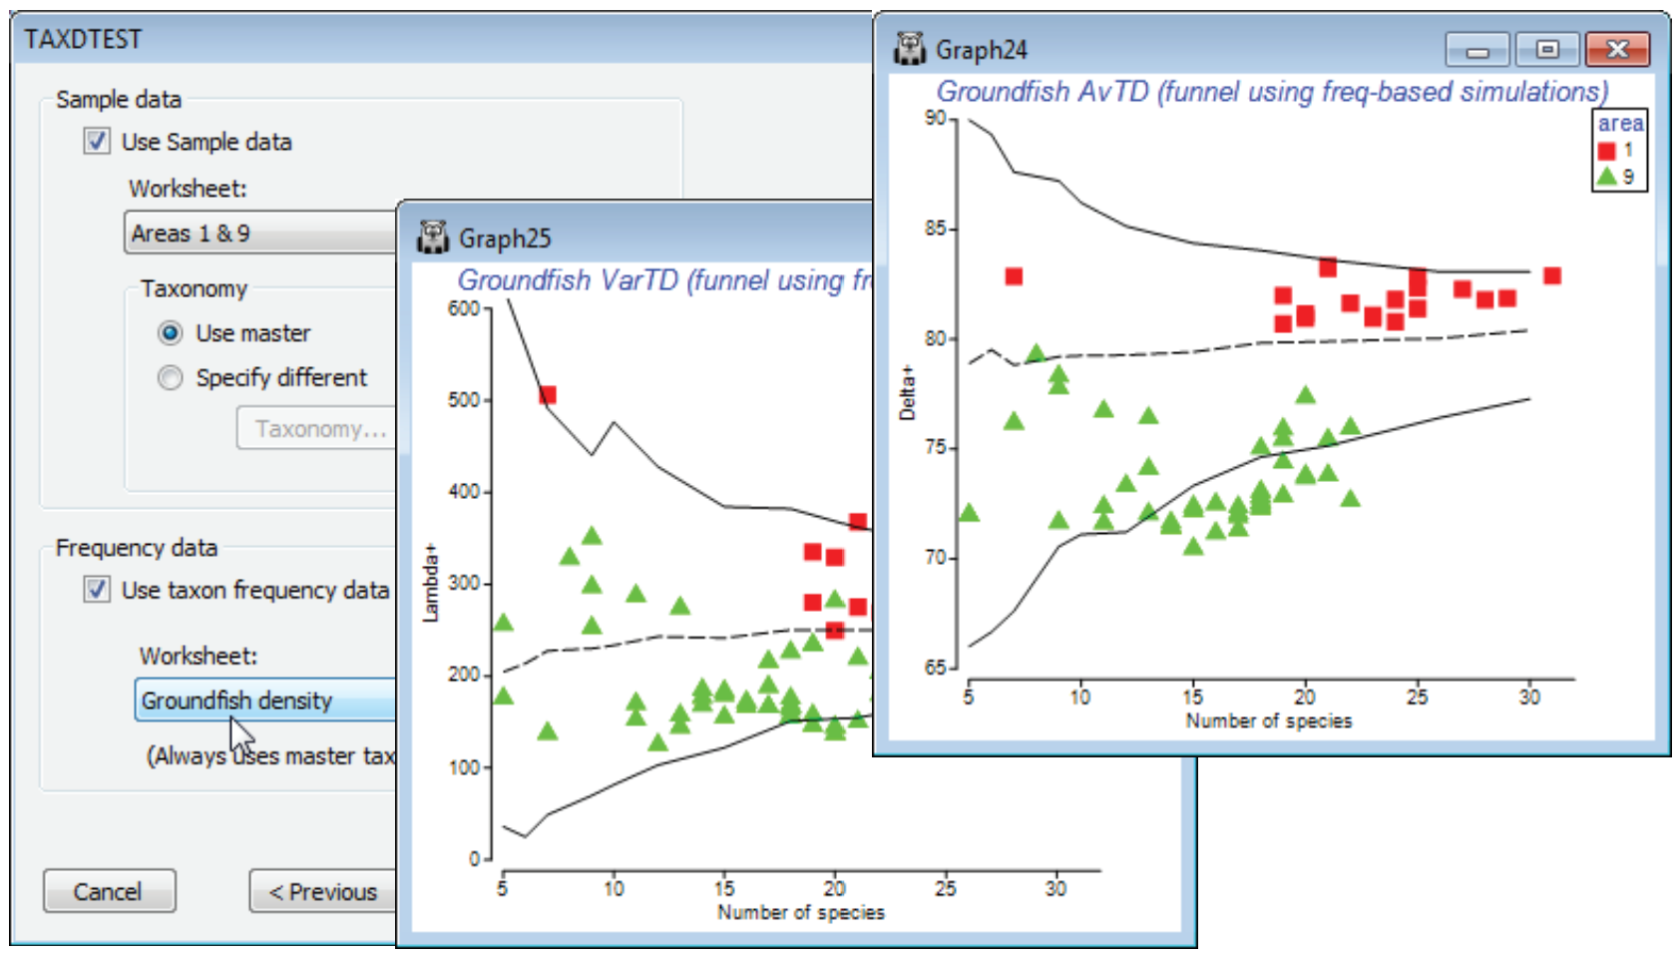
Using taxon frequency in simulations
Another option on the TAXDTEST dialogs is that the simulation of random draws from the master list, to generate histograms, funnels etc, can be constrained to match the probabilities of occurr¬ence of each species, as observed in a large set of samples defining those taxon frequencies. Thus certain species are picked more often in the random subsets, because they are observed to be present more often in real samples of this type. The simulated mean and range of (e.g.) AvTD values generated in this way could be argued to give a more realistic yardstick for assessing the observed AvTD. These are produced by checking (✓Use taxon frequency data) and supplying a data matrix (which will be turned into P/A, if it is not already that), with a wide spread of samples of the full set of species in the master taxonomy, which can be used to calculate frequencies of occurrence.
A natural example here would use the full Groundfish density sheet (having removed the earlier selection), with its large number of samples (277) determining probabilities of occurrence of each of the 93 species in any one sample. Now run Analyse>TAXDTEST on Groundfish taxonomy, again with (Plot type•Funnel), the default taxonomy options and (✓Use Sample data)>(Worksheet: Area 1 & 9), as before, but with (✓Use taxon frequency data)>(Worksheet: Groundfish density). Specifying S ranges as previously produces the plot shown below, in which the frequency-based simulated mean is no longer exactly independent of the sub-list size s, though the increase with s is seen to be slight here, on the scale of the probability limits, and the conclusions would be largely the same. Of course, the real $\Delta^{\scriptscriptstyle +}$ values are unchanged – they are not a function of assumptions made about the relevant master list to simulate from, or whether to carry out simple random or frequency-based simulations. And naturally, if your study does not lend itself to testing hypotheses about assembly rules of species drawn from any sort of regional master list, you can simply use the taxonomic indices in the same way as demonstrated earlier for a range of diversity measures, in a purely comparative way across a series of groups, in univariate means plots or ANOVA tests based on the replicate information. (E.g. you can select a single measure, such as $\Delta^{\scriptscriptstyle +}$, and take Euclidean distances on its 277 values across all rectangles here, inputting that resemblance matrix to the PERMANOVA routine in the PERMANOVA+ add-on, to give exactly the ANOVA table for a one-way test of the area factor, with the F value tested by permutation, not F distribution tables).

