(Phuket coral transect)
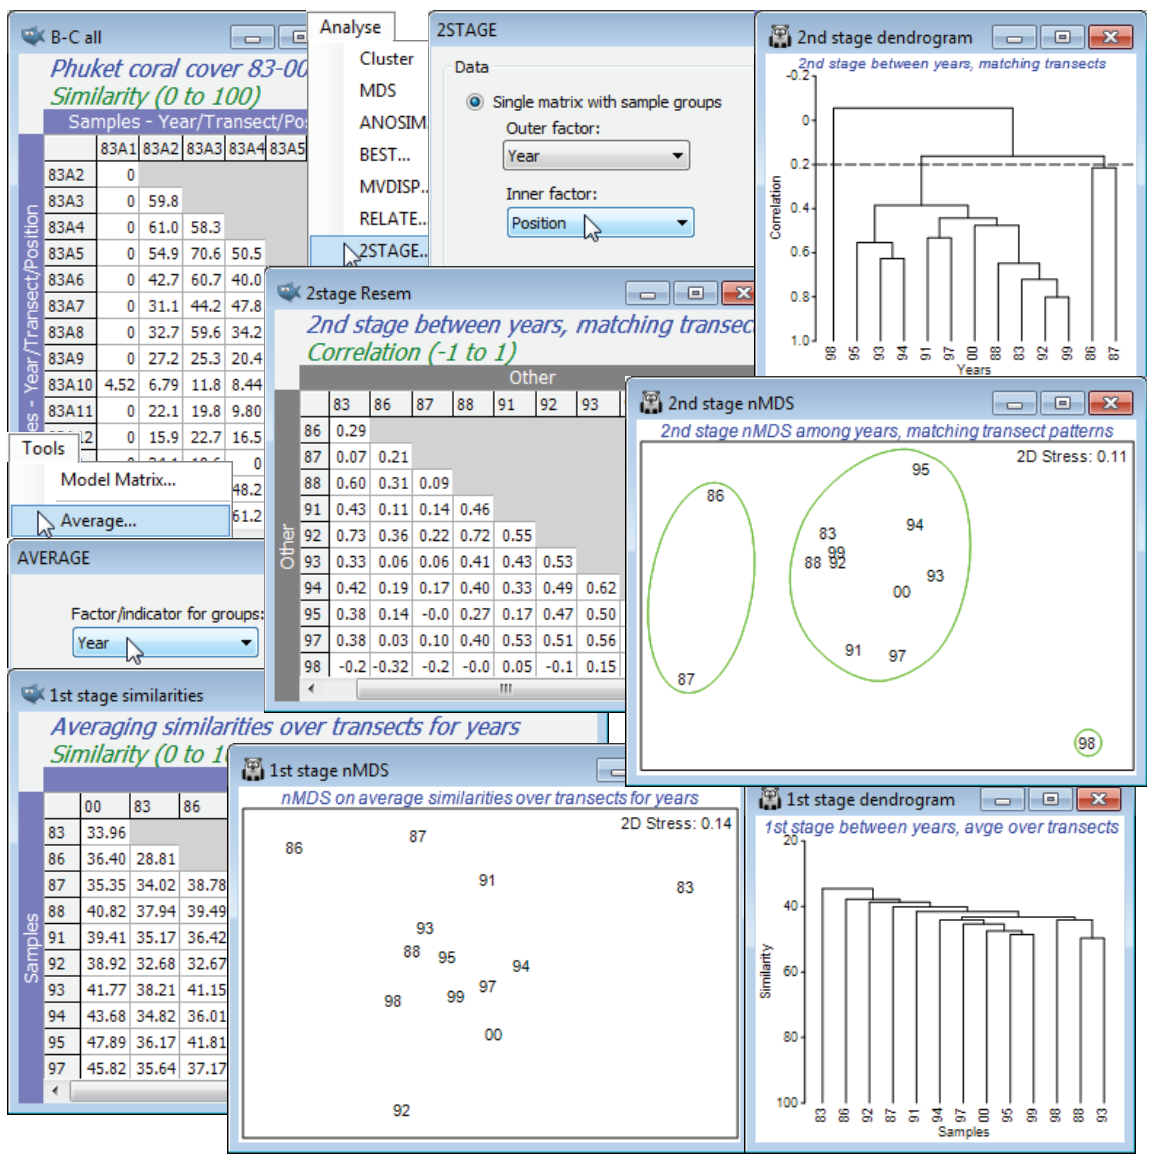
Open the workspace Phuket ws, of coral cover for the Ko Phuket transect A, in C:\Examples v7\ Phuket corals, or if not available, open the data files Phuket coral cover 83-87, 88-97 and 98-00, and Tools>Merge them (as in Section 11), taking the defaults to produce the full inter-annual series, Phuket coral cover 83-00. This has 156 samples, in a 2-way crossed design split into 13 years, with 12 positions along the onshore-offshore transect (look at the factors Year and Position with Edit>Factors). Create the similarity matrix for all 156 samples as previously: Bray-Curtis on square-root transformed data, renaming it B-C all. On this, take Analyse>2STAGE>(Data•Single matrix with sample groups)>(Outer factor: Year) & (Inner factor: Position) & (Correlation method •Spearman rank) to produce the 2nd stage matrix, renamed 2stage Resem. On this, run Analyse>CLUSTER and Analyse>MDS, drawing clusters on the MDS using Graph>Special>(✓Overlay clusters) – see Section 8 – with slice at resemblance ($\rho$) of 0.2. Contrast this 2nd stage plot with the (1st stage) MDS of years, averaging over the transect positions with Tools>Average for factor Year (on original or transformed data, or perhaps from the similarity matrix B-C all – a case can be made for all three methods here!), then re-run the MDS. Although testing is impossible in this case, it is clear that this first stage plot of the year ‘main effect’ is less sensitive in picking up the impacts of sedimentation (86 and 87) and desiccation (98) than the second stage analysis, concentrating on the consistency over years of the spatial pattern along the transect (‘interaction’ effects).
Save and close the Phuket ws. A more natural context for 2nd stage analysis is that of temporal studies, in which similarities in the time course are being compared across sites under different conditions, and this can give rise to cases where tests for this rather general concept of ‘interaction’ between time and space are possible, as in the time series for Tees Bay macrofauna now examined.

