Printing results and graphs
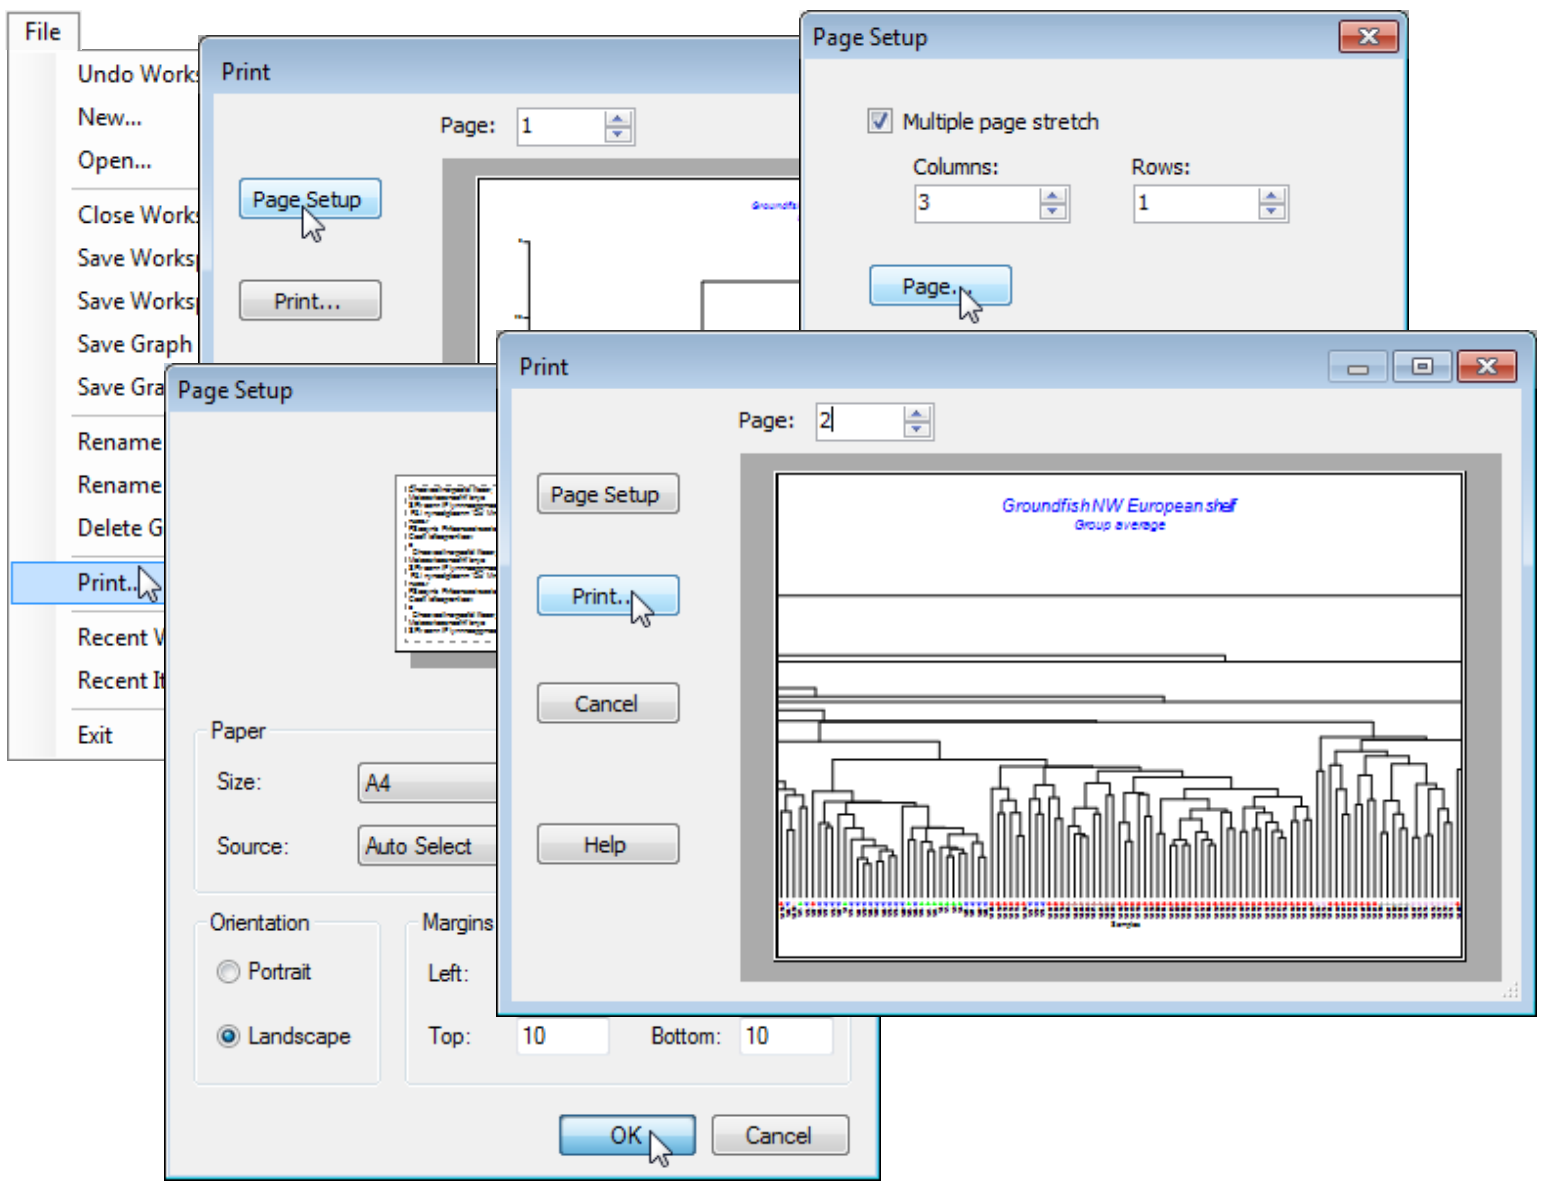
Direct printing from PRIMER is also possible for analysis endpoints such as results windows, all graphics windows, and notes (but not data sheets or resemblance matrices, which are generally too large and unwieldy for easy printing – selections of them are best saved to Excel or other software with capacity to size rows and columns into printable form). On plots, results or notes, File>Print>Print will take the default options and send you to the standard Windows dialog for selection of printer, any printer preferences, etc. However, for plots only, there is a PRIMER-specific option which can be taken prior to the final Print instruction, accessed by Page Setup after selection of File>Print. This allows a plot to be spread, horizontally and/or vertically, over multiple pages. It can sometimes be very useful in reading a cluster dendrogram based on many samples (thus printed over multiple horizontal pages) or in viewing a Shade Plot, perhaps from Wizards>Matrix display (Section 10), which can use a (✓Multiple page stretch) of the plot both horizontally and vertically. Also on the Page Setup dialog box, the Page button gives an alternative means of implementing simple printing choices of •Portrait or •Landscape, paper size and source, and margin sizes.
The facility to stretch a plot over multiple printed pages is best illustrated for one of the previous data sets so, leaving the Bristol Channel ws workspace open, launch another run of PRIMER and, if the workspace from the C:\Examples v7\Europe groundfish directory is available (last saved in Section 6), take File>Open>(File name: Groundfish ws) and click on the dendrogram, Graph2, to make that the active window – or re-run that cluster analysis of 277 samples. By File>Print>Page Setup>(✓Multiple page stretch)>(Columns: 3) & (Rows: 1)>Page>(Orientation: Landscape)>OK, the viewing window in the Print dialog box now shows the left side of the dendrogram as (Page: 1), and changing that to (Page: 2) displays the centre and (Page: 3) the right side, with some overlap to aid the physical pasting of the three printed pages which now result from Print. You will also find that an optimal printing will need to greatly reduce font and symbol sizes for all elements of the plot – in fact for most, if not all, of the font options (including Overall font scale) on the General, Titles, X axis, Y axis and Keys tabs of the Graph Options dialog and also the symbols plotted in the key, whose sizes are controlled from the (Size: $\text{\hspace{3mm}}$ ) option under Samp. labels & symbols.
File>Save Workspace the Groundfish ws and close down this second PRIMER desktop by the File>Exit menu item, leaving open the Bristol Channel ws workspace.

