(Plymouth particle-size analysis)
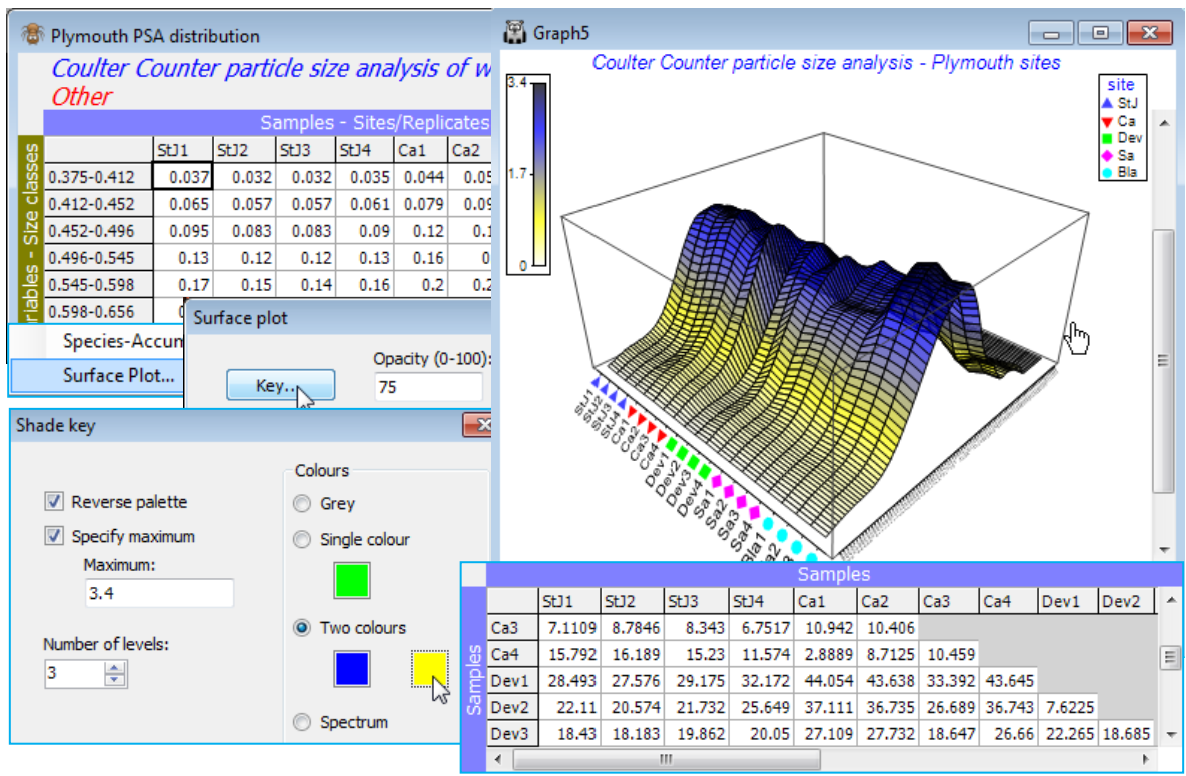
An example of a particle-size analysis (PSA) matrix has already been seen for Danish sediments at the end of Section 4, for which the histogram was smoothed by cumulating the size-classes. Here we examine instead an already smooth frequency distribution from Coulter Counter processing of water samples, in which large numbers of suspended particulates are automatically sized into one of 92 logarithmically increasing particle-diameter ranges (the variables). The samples are of four replicate water samples from each of five Plymouth sites, and some analysis is presented towards the end of Chapter 8 of CiMC. The directory C:\Examples v7\Plymouth PSA holds the frequency distributions in Plymouth PSA distribution. Columns are samples, and entries are % particles in each size-class (add to 100). The curves are conveniently viewed with Plots>Surface Plot, colour changed with Graph>Special>Key, zoomed with Graph>Zoom In or the ![]() icon, and rotated with Graph>Rotate Axes or the
icon, and rotated with Graph>Rotate Axes or the ![]() icon (hold-click and move cursor). Create Manhattan distances among the curves, with Analyse> Resemblance>(Measure•Other: D7 Manhattan distance), which could go into ANOSIM to test for characteristic site differences in PSA profiles at these times.
icon (hold-click and move cursor). Create Manhattan distances among the curves, with Analyse> Resemblance>(Measure•Other: D7 Manhattan distance), which could go into ANOSIM to test for characteristic site differences in PSA profiles at these times.

