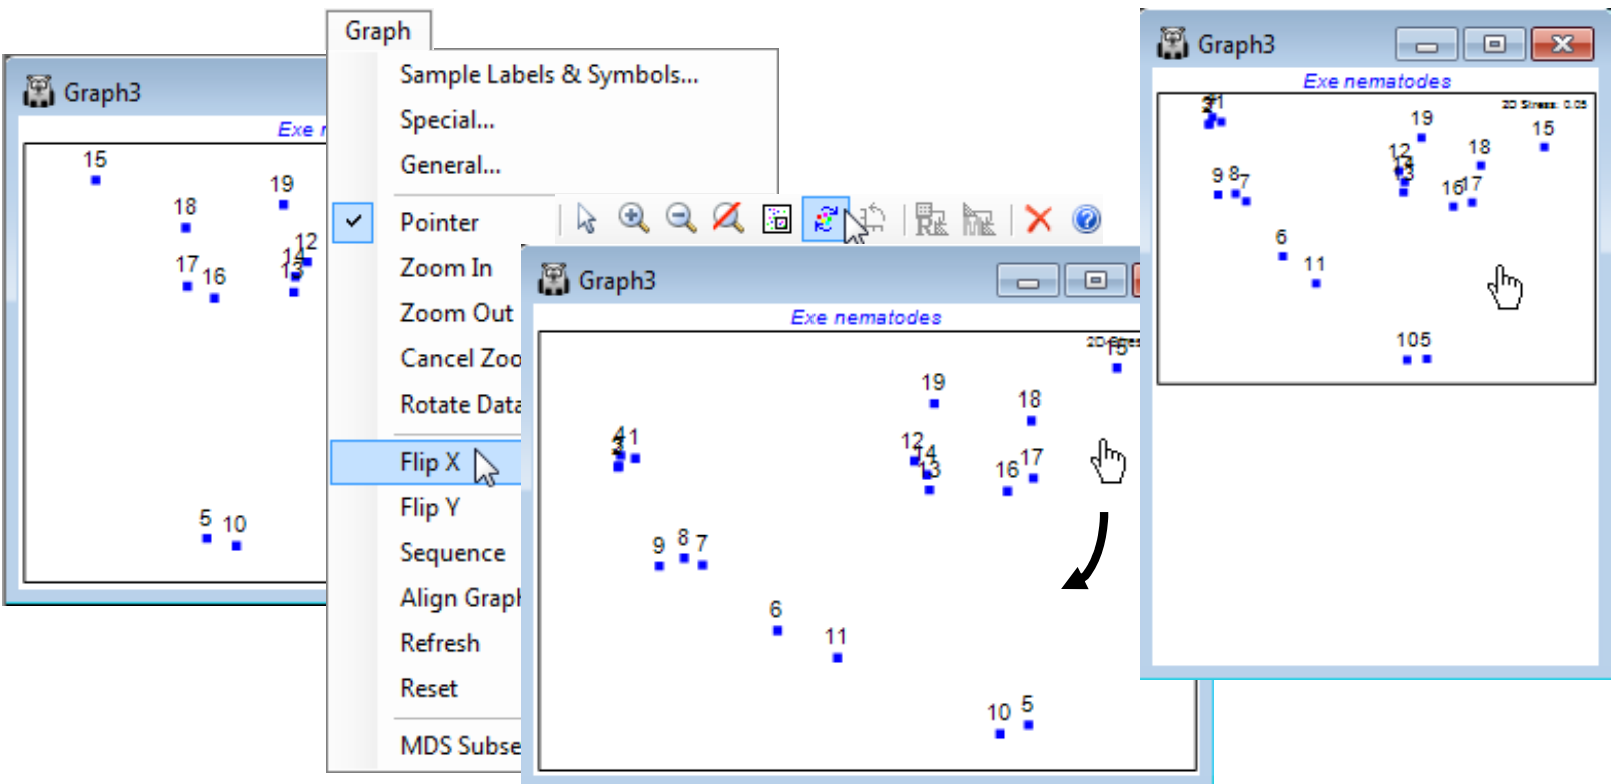
Graph menu: rotating and flipping the 2-d ordination
nMDS ordinations (unlike mMDS) have no meaningful axis scales for the configuration, since they use only ranks rather than original dissimilarities. There are also no defined directions for plot axes (unlike PCA, Section 12, or PCO, PERMANOVA+ add-on), so MDS plots (of any type) can be arbitrarily rotated, with Graph>Rotate Data, or by clicking on the Rotate data icon ![]() on the tool bar. The cursor changes to a hand
on the tool bar. The cursor changes to a hand ![]() and by clicking, holding and dragging, the plot can be rotated continuously within its current rectangular frame. Purely for reasons of presentation, wide, fat plots are usually preferred to high, thin ones, so the MDS algorithm defaults to orienting the plot with its major axis across the page (which it does by inputting the final MDS co-ordinate positions into a PCA, and the internal axes scales are then determined by the major axis being normalised to mean zero and variance one – do not confuse this purely presentation feature with running a PCA on the original data!). However, any orientation is equally meaningful so if a specific orientation is needed for external reasons (e.g. to attempt to match a community ordination to the geographic location of the samples), once the desired rotation is achieved the cursor can be changed back to
and by clicking, holding and dragging, the plot can be rotated continuously within its current rectangular frame. Purely for reasons of presentation, wide, fat plots are usually preferred to high, thin ones, so the MDS algorithm defaults to orienting the plot with its major axis across the page (which it does by inputting the final MDS co-ordinate positions into a PCA, and the internal axes scales are then determined by the major axis being normalised to mean zero and variance one – do not confuse this purely presentation feature with running a PCA on the original data!). However, any orientation is equally meaningful so if a specific orientation is needed for external reasons (e.g. to attempt to match a community ordination to the geographic location of the samples), once the desired rotation is achieved the cursor can be changed back to ![]() by Graph> Pointer. A new addition in PRIMER 7 is the Graph>Reset option, which allows you to reset the plot to the default orientation of the original MDS run, when the co-ordinate positions of the points on the plot will match those in the worksheet which may have been requested by (✓Ordinations to worksheet). It was noted in connection with cluster dendrogram rotations that the current ordination co-ordinates, after rotation, can always be retrieved by File>Save Graph Values As, to obtain an external text file (which could always be read back into PRIMER on the odd occasion when this might be required – though because of the arbitrariness of MDS axes it is generally not desirable to use single axis co-ordinates in subsequent regression/correlations, e.g. linking to abiotic variables).
by Graph> Pointer. A new addition in PRIMER 7 is the Graph>Reset option, which allows you to reset the plot to the default orientation of the original MDS run, when the co-ordinate positions of the points on the plot will match those in the worksheet which may have been requested by (✓Ordinations to worksheet). It was noted in connection with cluster dendrogram rotations that the current ordination co-ordinates, after rotation, can always be retrieved by File>Save Graph Values As, to obtain an external text file (which could always be read back into PRIMER on the odd occasion when this might be required – though because of the arbitrariness of MDS axes it is generally not desirable to use single axis co-ordinates in subsequent regression/correlations, e.g. linking to abiotic variables).
In a similar way, MDS plots can be reflected on axes by Graph>Flip X or Flip Y, and the default configuration returned to by Graph>Reset. Though it is clear that much information about the axes (scaling, orientation, reflection) is arbitrary with nMDS, what is not arbitrary of course – in fact central to the method – is relative distances apart of points. Changing the aspect ratio of the points in an MDS plot (shrinking or expanding it along one axis only) destroys the key inferences, of the form ‘samples 15 and 16 are closer together than 5 and 6 therefore they are more compositionally similar’ (even though the direction of 15 to 16 is perpendicular to that of 5 to 6). Within PRIMER, this is not a concern. For the MDS plot, Graph3, in the Exe workspace, try flipping and re-orienting the plot and reshaping the window and you will see that the plot preserves the original relationships among the points rather than, for example, taking up the shape of the new window (as it would do with a cluster dendrogram). You should, however, be careful not to reshape the plot later, having saved or copied it via the clipboard to Powerpoint or other graphics presentation package.

