Funnels for a range of sublist sizes
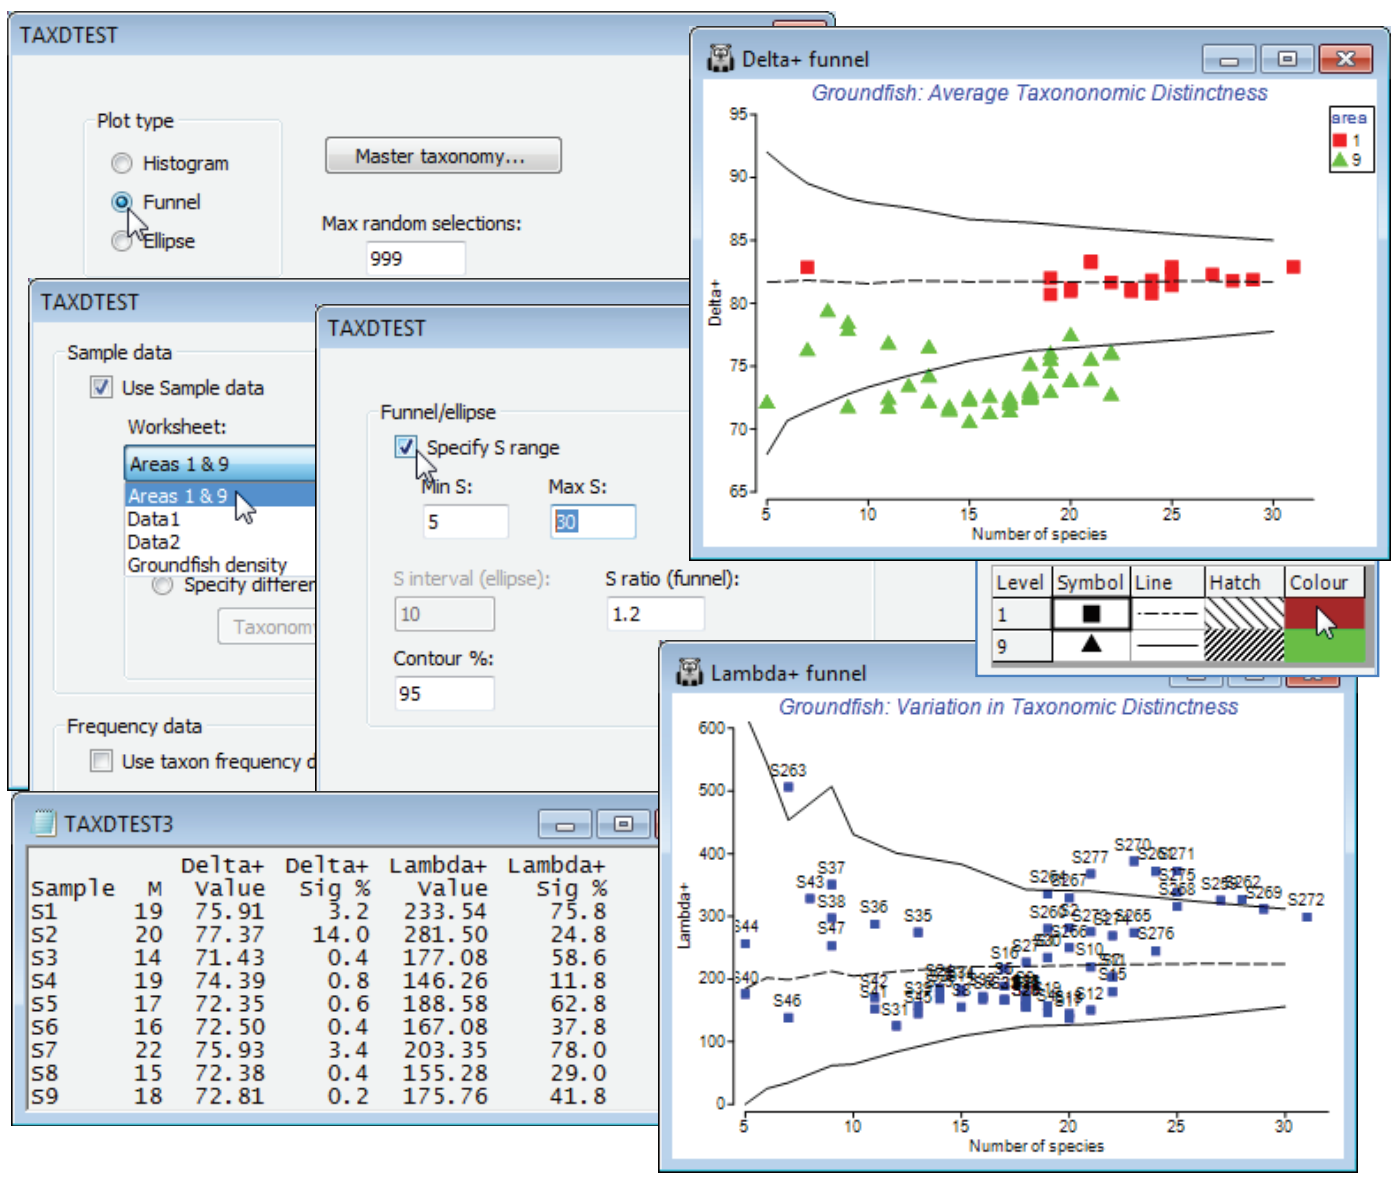
It is impractical to produce detailed histograms, such as those above, for each of the 277 samples, so a preferable option is just to view the 95% lower and upper limits for a range of sample sizes S, using a funnel plot so that a set of samples can be plotted on this. So, first select all sea area 9 (E Central N Sea) and sea area 1 (Bristol Channel) samples from Groundfish density, with Select>Samples>(•Factor levels)>Factor name: area>Levels, leaving only 1 and 9 in the Include box, and Tools>Duplicate this, renaming it Areas 1 & 9 (and remove the selection on the original sheet with Select>All, for later use). Then run Analyse>TAXDTEST again, on Groundfish taxonomy, with (Plot type•Funnel) & (Max. random selections: 999) and Next>(✓Use Sample data>Worksheet: Areas 1 & 9). Now, Next>(Funnel/ellipse✓Specify S range)>(Min S: 5) & (Max S: 30), to span the spread of S values on the display. The (S ratio (funnel): 1.2) option determines how many S values are calculated in the range 5 to 30, the S values stepping up by multiples of 1.2 by default (then rounded), thus S = 5, then 6 (=5$\times$1.2) etc. The final box on this screen gives 95% intervals if the default is taken (2.5% of simulations fall above the upper limit and 2.5% below the lower limit).
The results and funnel plots for $\Delta^{\scriptscriptstyle +}$ and $\Lambda^{\scriptscriptstyle +}$ are shown below and indicate that, whilst area 1 samples are within expected ranges for average taxonomic distinctness, based on the 93 species master list, area 9 samples have reduced diversity (AvTD is the more easily interpretable of the two indices, since it measures the average breadth of the assemblage). Rogers et al 1999 (reference in Section 5) discuss possible reasons for this. Note that these plots have been tidied up, with Graph>Sample Labels & Symbols, by removing the labels and adding symbols for factor area, changing symbol size/colour etc, as for any other plot. The probability limits could be further smoothed by running with (Max random selections: 9999) but will still show kinks for small S, because S is discrete.

