Standardising samples
How the data are treated, prior to computation of a resemblance matrix (e.g. similarities), can have an important influence on the final analysis, and such decisions often depend on the practical context rather than any statistical considerations. For example, standardising the samples (by total) divides each entry in the data sheet by the total abundance in that sample, across all variables (species). This would turn assemblage counts for each sample into relative percentages (what is referred to by statisticians as compositional data), all samples then adding to 100% across species. It thus removes all differences in total abundance in each sample from the multivariate comparison of samples. Sometimes this may be desirable, e.g. where the unit of sampling cannot be tightly controlled. An example is the data we have just been working with (on W Australian fish diets), analysing the prey taxa in the gut contents of fish predators: the quantity of food in the gut varies across individual fish in an uncontrollable way so is not relevant to a multivariate comparison of the prey composition, and the data should initially be sample-standardised. On the other hand, a typical marine impact study, using sediment-dwelling fauna sampled by a corer of fixed size, more strictly controls the quantity of material in each sample. It might then be important to use the fact that a potentially impacted site contains 5 times fewer individuals, in total, than a control site, so sample standardisation would be undesirable. The philosophy in PRIMER 7 is that users control all such pre-treatment decisions, combining them in an order under their choice, appropriate to the context. Each pre-treatment step results in display of a revised datasheet so the user can see its effect, before proceeding to analysis (or in some cases a further pre-treatment step).
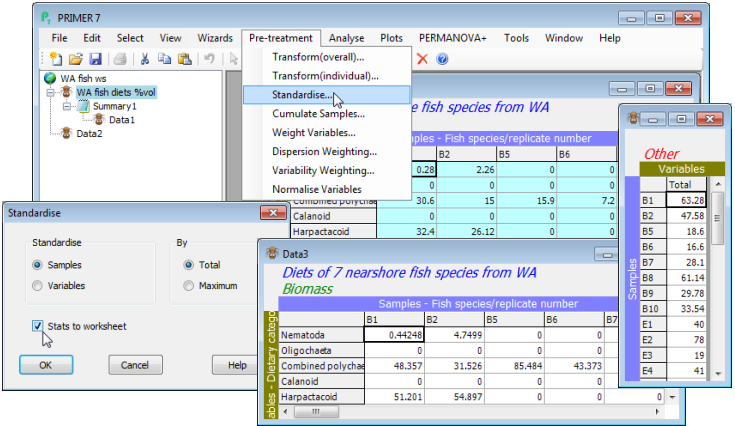
Re-open the workspace WA fish ws from the directory C:\Examples v7\WA fish diets, or if not previously saved, File>Open>Filename: WA fish diets %vol.pri. (Note that if you had a selection in place at the time the workspace was saved, this will still be operational. You can leave this on or deselect it with Select>All, but it might make sense to leave samples A9, B3 and B4 excluded, because of their very low sample totals – gut fullness <<10% – and thus unreliable % composition after standardising). Take Pre-treatment>Standardise>(Standardise•Samples) & (By•Total) & (✓Stats to worksheet). You will see from the resulting sheet (probably named Data3) that samples are now expressed as % composition of each prey category, the columns adding to 100.

