Dissimilarity preservation as a matrix correlation
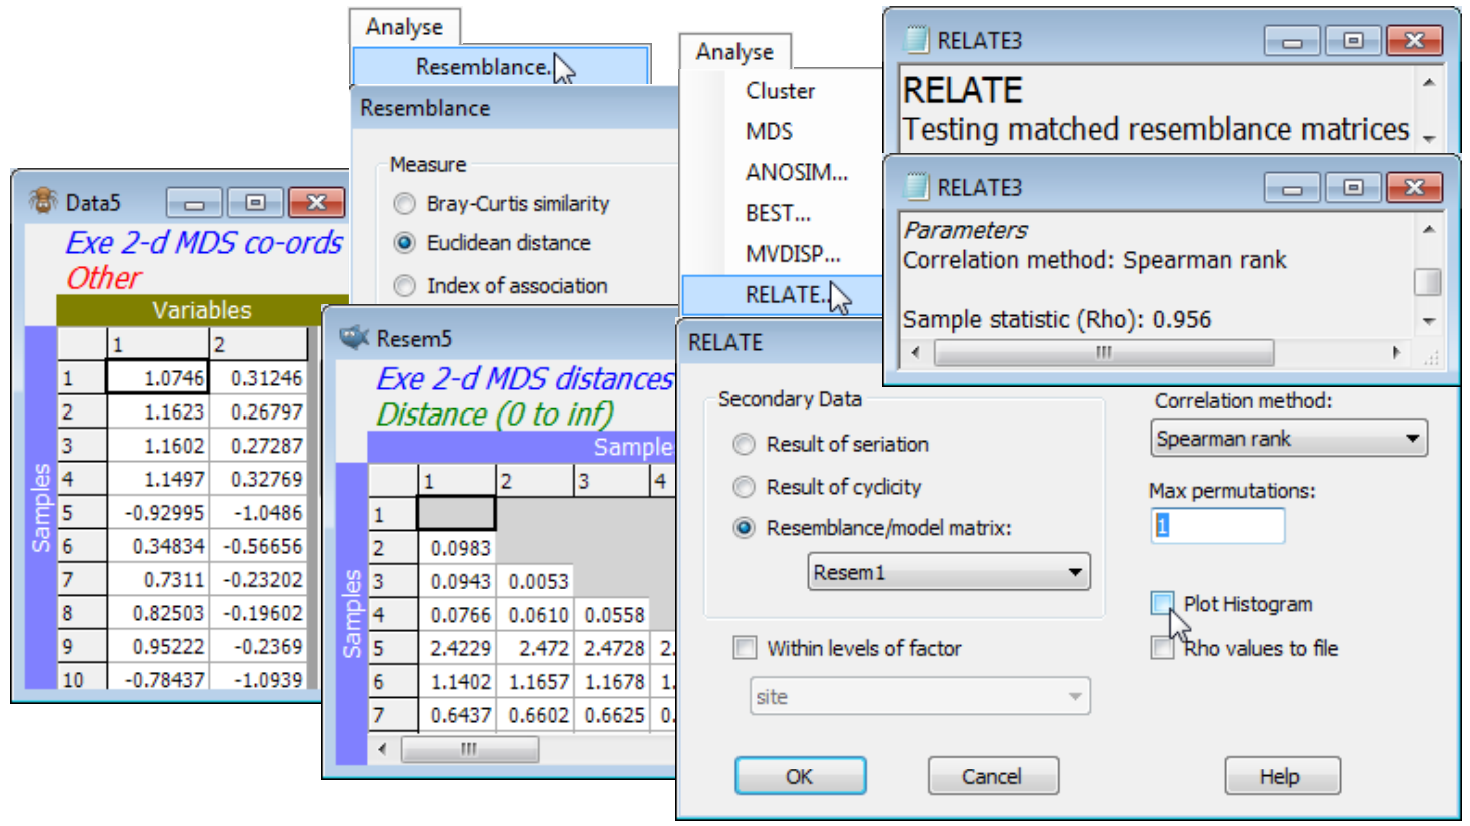
One can also ask how well the (Euclidean) distances among points in the nMDS plot correlate with the dissimilarities in the resemblance matrix. The former are calculated by running the ordination co-ordinates (output to Data4 and Data5 by the ✓Ordinations to worksheet instruction in the above example) through Analyse>Resemblance>(•Euclidean distance). Then, just as for the Cophenetic correlation heading in the Section 6 cluster analyses, which was carried out on the same Exe data, a matrix correlation between these two triangular matrices requires a run of the Analyse>RELATE routine (Section 14), e.g. with the distance matrix as the active sheet and the dissimilarities Resem1 as the secondary data (or vice-versa). The only difference this time is that the option to compute a rank correlation such as Spearman should be taken (a rank Mantel-type correlation), since this is nMDS and the Shepard plot is not linear. (It is often overlooked that Pearson correlation measures only linearity of a relationship – a stress of zero corresponds to Spearman $\rho_S$= 1 but Pearson $\rho$< 1, when the increasing relationship is perfect but not linear). The permutation test in RELATE is not required since $\rho$= 0 is not a sensible null hypothesis, so set Max permutations: 1 and uncheck the Plot Histogram box, giving $\rho_S$= 0.956 for the 2-d nMDS and 0.965 for the 3-d configuration.

